Key Takeaways
- Palantir shares hit another all-time high during Tuesday’s session amid optimism that the data analytics software provider will benefit from massive AI spending.
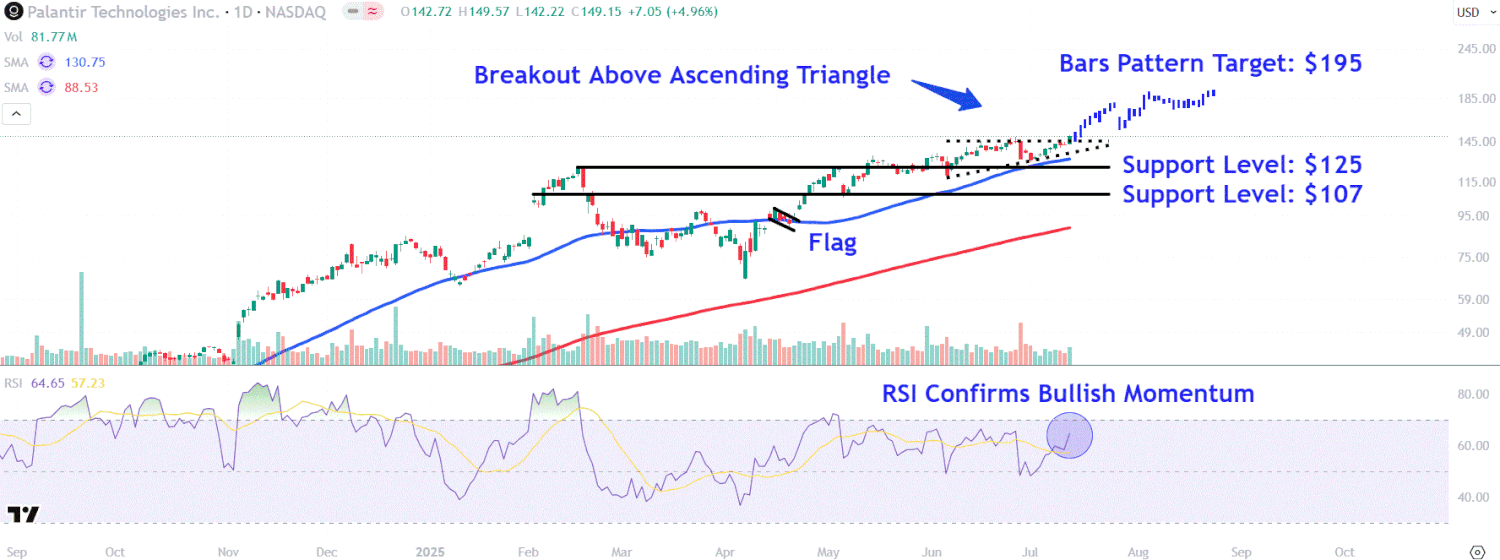
- The stock traded within an ascending triangle before nudging above the pattern’s top trendline in Monday’s trading session, potentially setting the stage for a continuation move higher.
- Bars pattern analysis forecasts a potential upside target of around $195 and indicates the shares could continue trending until late August.
- Investors should watch two major support levels on Palantir’s chart around $125 and $107.
Palantir Technologies (PLTR) shares hit another all-time high during Tuesday’s session amid optimism that the data analytics software provider will benefit from massive AI spending.
The company’s CEO, Alex Karp, was among the executives in attendance Tuesday, along with President Donald Trump, at an energy and AI summit in Pittsburgh, where companies announced tens of billions of dollars in investments in energy infrastructure and data centers.
Jeff Swensen / Getty Images
Last week, Wedbush analysts said in a client note that Palantir could be in a “sweet spot” to benefit from federal spending in North America and Europe, adding that the Trump administration’s focus on AI initiatives provides another tailwind for the stock.
Palantir shares have nearly doubled since the start of the year, making the stock the biggest advancer in the S&P 500 in 2025, boosted boosted by surging enterprise and government AI spending, including several lucrative defense contracts. The stock hit an intraday record of near $151 Tuesday morning, but closed the session slightly lower at $148.58.
Below, we break down the technicals on Palantir’s chart and point out price levels that investors will likely be watching.
Ascending Triangle Breakout
Palantir shares traded within an ascending triangle before nudging above the pattern’s top trendline in Monday’s trading session, when the stock closed at a record high, potentially setting the stage for a continuation move higher.
Meanwhile, the relative strength index confirms bullish momentum, though the indicator remains below overbought levels, providing the shares with ample room to explore higher prices.
Let’s apply technical analysis to forecast how an ongoing uptrend in Palantir shares may unfold and also identify two support levels worth monitoring during future pullbacks in the stock.
Bars Pattern Analysis
Investors can forecast how a move higher in Palantir shares may look by using the bars pattern tool, a technique that analyzes earlier trends on the chart to projects future directional movements.
When applying the analysis, we extract the stock’s trend higher between a prior flag and the ascending triangle and reposition it from the pattern’s upper trendline. This projects an upside target of around $195 and indicates the shares could continue trending until late August if price action rhymes with that earlier move.
Support Levels Worth Monitoring
The bulls’ failure to defend the ascending triangle’s top trendline could see the shares retrace toward $125. This area, currently positioned just below the 50-day moving average, would likely provide support near the prominent February peak and a period of sideways drift that formed on the chart throughout most of May.
Finally, a deeper pullback in the stock could lead to a retest of lower support around $107. Investors may look to accumulate Palantir shares in this region near the high to February’s earnings-driven breakaway gap, which closely aligns with the completion of a brief profit-taking dip in early May.
The comments, opinions, and analyses expressed on Investopedia are for informational purposes only. Read our warranty and liability disclaimer for more info.
As of the date this article was written, the author does not own any of the above securities.


