
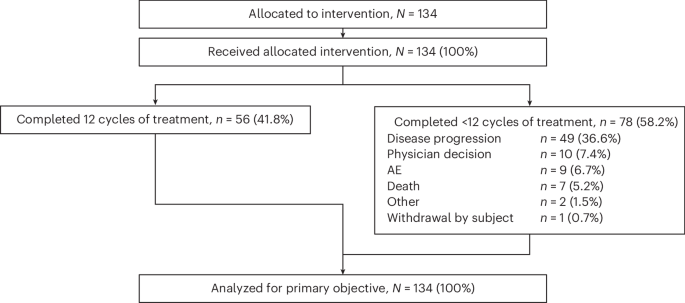
BP41072 is an ongoing, open-label, multicenter, phase 1/2 dose-escalation and dose-expansion study. Part 1 of the study was an open-label, nonrandomized, phase 1 study of escalating doses of englumafusp alfa in combination with the anti-CD20 monoclonal antibody obinutuzumab in patients with R/R B-NHL and will be reported elsewhere. Part 2 of the study was an open-label, nonrandomized, phase 1 study of escalating doses of englumafusp alfa in combination with the CD20×CD3 bispecific antibody glofitamab in patients with R/R B-NHL and is reported herein. Part 3 is the dose-expansion stage of the study that is currently ongoing to further evaluate the anti tumor activity of englumafusp alfa plus glofitamab dosing regimens showing promise in part 2 in patients with R/R B-NHL. All stages of the study were conducted in accordance with the International Council for Harmonization guideline for Good Clinical Practice and the principles of the Declaration of Helsinki. The protocol was approved by the institutional review board and/or ethics committee at each participating center (Supplementary Table 1). All patients provided written informed consent and were not compensated.
Patients
Patients eligible for part 2 of the study were aged ≥18 years, with aggressive B-NHL (DLBCL, PMBCL, Richter’s transformation, transformed follicular lymphoma or grade 3b follicular lymphoma) or indolent B-NHL (grade 1–3a follicular lymphoma, MZL or mantle cell lymphoma) and had relapsed after or failed to respond to at least one previous line of therapy. Patients had one or more measurable lesion by computed tomography scan and an Eastern Cooperative Oncology Group (ECOG) performance status of 0 or 1. Full inclusion and exclusion criteria are outlined in the study protocol.
Study treatment
Obinutuzumab (1,000 mg) was administered 7 days before the first glofitamab dose to mitigate the risk of CRS7. Glofitamab (intravenous infusion) was administered over 12 cycles, starting with step-up dosing in C1 (14 days) and continuing with the target dose in C2–C12 (21 days each). The standard step-up regimen was 2.5 mg on C1D1 and 10 mg on C1D8, followed by the 30 mg target dose on D1 from C2 onwards. An alternative extended step-up regimen was 0.2 mg on C1D1, 1.5 mg on C1D3 and 10 mg on C1D8. Premedication was administered before each glofitamab dose per the protocol.
In the dose-escalation cohorts, englumafusp alfa (intravenous infusion) was administered at escalating dose levels based on a modified continual reassessment method with escalation with overdose control. In those cohorts, englumafusp alfa was started on C2D8 and continued on D1 of each subsequent cycle. In subsequent cohorts, englumafusp alfa was started during glofitamab step-up dosing on C1D10.
Objectives and endpoints
Primary objectives were to establish the MTD and safety and tolerability of englumafusp alfa in combination with glofitamab following obinutuzumab pretreatment. Primary endpoints were the nature and frequency of dose-limiting toxicities and the incidence, nature and severity of AEs. Secondary objectives included evaluation of antitumor activity, with ORR and CMR as key endpoints, pharmacokinetics, pharmacodynamics and mode of action.
Safety and efficacy assessments
AEs were graded according to the National Cancer Institute Common Terminology Criteria for Adverse Events v5.0. CRS was graded according to the American Society for Transplantation and Cellular Therapy consensus criteria31.
Response was assessed according to the Lugano classification32, using fluorodeoxyglucose-positron tomography and computed tomography scans at screening and on C3D1, C6D1 and C9D1, at the end of treatment and every 6 months during follow-up until disease progression.
Pharmacokinetics
Pharmacokinetic endpoints included the Cmax and Cmin of englumafusp alfa in serum and area under the curve.
A population pharmacokinetic analysis was conducted using nonlinear mixed-effects modeling with NONMEM software version 7.5.0 (Icon Development Solutions)33. A first-order conditional estimation with interaction method was used for model development. A preliminary two-compartment model incorporating both linear and Michaelis–Menten (saturable) elimination pathways was selected to describe englumafusp alfa disposition, serving as a mechanistic approximation of target-mediated drug disposition (Extended Data Fig. 5). Bodyweight was included as a covariate on clearance and volumes of distribution.
Pharmacodynamics and tissue biomarkers
Blood samples were collected from all patients at predefined time points during treatment per the protocol. T cells, B cells and natural killer (NK) cells, monocytes, activated T cells, B cells and NK cells, proliferating T cells, naive and memory T cells were evaluated centrally (Q2 Solutions) using validated flow cytometry assays as described below. Plasma samples were collected for cytokine (CXCL-10, interleukin-6 (IL-6), IL-8, IL-10, IL-2, soluble CD25, interferon-γ, tumor necrosis factor) analysis using validated multiplex immunoassays on a ProteinSimple Ella platform. ctDNA dynamics were evaluated by the Avenio ctDNA assay34 (Roche) at protocol-specified time points in patients with aggressive B-NHL.
Patients entering the study also provided a pretreatment screening biopsy sample, fresh or a formalin-fixed, paraffin-embedded archival specimen (<100 days from study D1 and uninterrupted by a previous therapy), for retrospective immunohistochemical assessments. Biopsy specimens were sent to the central pathology laboratory (Discovery Life Sciences) and fresh tissues were fixed and embedded on receipt. All biopsy samples were quality checked by a pathologist on hematoxylin and eosin staining to confirm sufficient tumor content. Consecutive sections were provided for immunohistochemical analysis using CD19 (LE-CD19 mouse monoclonal, stained on Ventana Benchmark Ultra), CD20 (L26 mouse monoclonal, stained on Ventana Benchmark Ultra Scanner: iScan HT 20X) and CD8/Ki67 (CD8 SP239 rabbit monoclonal, Ki67 30-9 rabbit monoclonal, stained on Ventana Discovery Ultra) assays. Digital quantifications were performed on the whole tumor region, including the diffuse or the pseudofollicles and associated tumor stroma. For CD19, modified H-scores were calculated as 2 × (% moderate positive stain) + 3 × (% strong positive stain). As a note, weakly positive stained cells were not captured due to the narrow dynamic range making detection of these cells technically challenging. CD8/Ki67 nucleated cells were enumerated and the Ki67+CD8− cell densities (per mm2) were provided across the entire tumor region. A board-certified pathologist reviewed the results.
Flow cytometry
Sample preparation
For the A167 T cell, B cell and NK cell (TBNK) assay, whole blood was collected in CytoChex tubes, transferred to a fluorescence-activated cell sorting (FACS) tube and stained with the antibody cocktail. Samples were lysed with BD FACSLyse and acquired.
For the A207 naive and memory T cell (CD279) assay, whole blood was collected in CytoChex tubes and transferred to polystyrene tubes (for full staining or fluorescence minus one control). Following incubation with the respective antibody cocktails, red blood cells were lysed with BD FACSLyse and samples were washed and acquired on a BD FACS Canto II cytometer.
The A234 T cell proliferation and activation assay uses whole blood collected in sodium heparin tubes. The sample preparation involves adding 100 µl of the specimen to tubes containing surface antibody cocktails (CD3, CD4, CD8 and HLA-DR). These samples are then processed on an LWA for red blood cell lysis and cell fixation and permeabilization using BD FACSLyse and Perm Buffer II. Subsequently, intracellular staining with Ki67 or an isotype control (IgG1) is performed, followed by a final wash program on the LWA before immediate acquisition on a BD FACS Canto II flow cytometer.
Cell population abundance
Cell populations from the TBNK assay are reported as percentage of lymphocytes, with the exception of CD14+, which are reported as percentage of leukocytes. For all other assays, target cell populations are reported as percentage of the immediate parent population or lymphocytes as indicated in the population designation.
Gating strategy
The A167 Q-TBNK assay gating strategy begins by excluding debris in the forward scatter (FSC)-A versus side scatter (SSC)-A plot. A specific gate is created to identify and exclude CD14+ monocytes to ensure they do not contaminate the subsequent lymphocyte analysis. From the remaining population, leukocytes are selected based on CD45 expression, and lymphocytes are further isolated as CD45− bright events with low SSC. This lymphocyte population is then used to identify CD3+ T cells (subsequently split into CD4+ and CD8+ subsets), whereas the CD3− population is analyzed to enumerate CD19+ B cells and CD16+ and CD56+ NK cells.
The gating strategy for the naive and memory T cells assay begins by identifying singlet populations using FSC (FSC-H versus FSC-W) and SSC (SSC-H versus SSC-W) properties to eliminate doublets and debris. From the singlet population, lymphocytes are selected based on scatter properties, followed by the identification of CD3+ T cells. This CD3+ population is then divided into CD4+ and CD8+ T cell subsets. Within these CD4+ and CD8+ populations, quadrant gates using CD45RA and CD197 (also known as CCR7) expression are applied to define naive T cells (CD45RA+CD197+), central memory T cells (CD45RA−CD197+), Tem cells (CD45RA−CD197−) and Temra cells (CD45RA+CD197−). Finally, CD279 (PD1) expression is identified on these subsets using gates established by fluorescence minus one controls.
For the T cell proliferation and activation (HLA-DR/Ki67) assay, the gating strategy begins by excluding doublets and debris through the identification of FSC and SSC singlets, followed by the selection of lymphocytes based on FSC-A versus SSC-A properties. From the lymphocyte population, CD3+ T cells are gated and subdivided further into CD4+ (helper T) and CD8+ (cytotoxic T) subsets. These subsets are then analyzed for activation and proliferation markers, where HLA-DR+ and Ki67+ populations are gated individually (using isotype controls for Ki67 validation). These gates are then combined in the hierarchy to define the dual-positive CD4+Ki67+HLA-DR+ and CD8+Ki67+HLA-DR+ populations.
The antibody reagents used in the TBNK assay, naive and memory T cell (CD279) assay and T cell proliferation and activation (HLA-DR/Ki67) assay are presented in Supplementary Tables 2–4.
Statistical analysis
The exact sample size for part 2 of the study could not be predetermined, because it was dependent on the number of cohorts required to reach the MTD and/or recommended phase 2 dose. A modified continual reassessment method with escalation with overdose control design was used to guide the dose escalation based on the occurrence of DLTs. The MTD was defined as the dose with the highest probability that the DLT rate is within the target of 20–30%, with a low probability (<25%) of overdosing (DLT rate >30%). Based on simulations for cohorts of three patients, the part 2 dose-escalation was estimated to require up to 66 patients. Including backfill cohorts, the maximum number of patients could increase up to 180.
The Medidata RAVE electronic data capture system was used to capture, manage, clean and report the trial data. Descriptive statistics were used to describe and summarize the data. Tables were generated using SAS version 9.4. Figures were generated using R version 4.4.1. Sex was based on self-reported demographics obtained at screening.
Safety was assessed in all patients who received at least one dose of any study treatment (safety-evaluable population). Efficacy was assessed in all patients who received at least one dose of any study treatment and had their first planned response assessment before the data cut-off (response-evaluable population). The Clopper–Pearson method was used to determine the 95% CI for CMR and ORR. Duration of response, PFS and OS were analyzed by Kaplan–Meier estimates; the Brookmeyer–Crowley method was used to construct the 95% CI for the duration of response, median PFS and median OS.
The nonlinear association between dose and frequency of peripheral T cell changes relative to baseline (C2D8 predose) were analyzed with the following model, pharmacodynamic change from baseline (CFB) ≈ baseline value + log dose + log dose2. Pharmacodynamic markers reported with nominal P value < 0.05 by the model were selected for the calculation of composite PD score. Normality through log transformation was assumed for flow cytometry cell fractions and cytokine levels.
Protocol deviations
Investigators were asked to document and promptly report to the Sponsor and institutional review board and/or ethics committee any protocol deviations that might have had an impact on patient safety and/or data integrity. Protocol deviations were reviewed by the Sponsor to assess whether any represented a serious breach of Good Clinical Practice guidelines and required reporting to health authorities. Prospective requests to deviate from the protocol were not allowed. Corrective measures are identified in the summary of protocol amendments, which has been included in the Supplementary Information.
Reporting summary
Further information on research design is available in the Nature Portfolio Reporting Summary linked to this article.



