
Trial design and participants
OUTSTAND-2 was a multicenter, randomized, double-blind, double-dummy, active-comparator-controlled trial evaluating once-daily oral safiglipron 30 mg, 60 mg and 90 mg versus dapagliflozin 10 mg in adults aged 18−75 years with type 2 diabetes (HbA1c 7.5−11.0%, body mass index (BMI) 19.0−40.0 kg m−2) inadequately controlled with stable metformin monotherapy. The trial comprised a 3-week single-blind run-in, a 32-week core treatment period, a 20-week extension and a 2-week safety follow-up (Extended Data Fig. 1). The primary endpoint was the change from baseline in HbA1c at week 32. Prespecified key secondary endpoints were HbA1c target achievement, fasting plasma glucose (FPG) and percentage change in body weight at week 32. Prespecified supportive secondary endpoints included changes in indices of β cell function and insulin sensitivity (HOMA-β and HOMA-IR), post-prandial glucose and insulin responses during a mixed-meal tolerance test (MMTT), waist circumference, seven-point self-monitored blood glucose (SMBG) profiles and the proportion receiving rescue therapy. Prespecified exploratory endpoints included changes in blood pressure, lipid parameters and urinary albumin-to-creatinine ratio (UACR). Patient-reported treatment satisfaction was assessed using Diabetes Treatment Satisfaction Questionnaire, status version (DTSQs). Safety endpoints included adverse events, hypoglycemic episodes, laboratory parameters, electrocardiograms and diabetic retinopathy assessments.
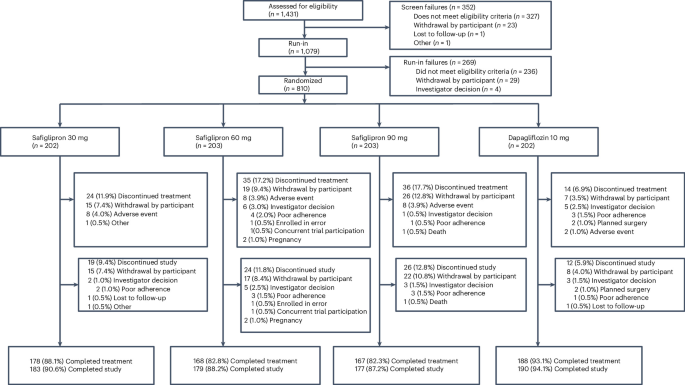
Between 27 September 2024 and 30 April 2025, a total of 1,431 participants were screened, of whom 810 underwent randomization; 202 were assigned to receive safiglipron 30 mg, 203 to receive safiglipron 60 mg, 203 to receive safiglipron 90 mg and 202 to receive dapagliflozin (Fig. 1). Overall, 809 participants received at least one dose of the assigned study treatment and comprised the safety population. During the 52-week treatment period, 178 (88.1%) participants in the safiglipron 30 mg group, 168 (82.8%) participants in the safiglipron 60 mg group, 167 (82.3%) participants in the safiglipron 90 mg group and 188 (93.1%) participants in the dapagliflozin group completed treatment (Fig. 1). Prespecified intercurrent events are reported in Supplementary Table 2.
Percentages use the corresponding randomized group size as the denominator. One participant in the safiglipron 60 mg group was found to fail eligibility criteria after randomization, and the investigator determined that no study drug would be administered, leading to immediate withdrawal from the trial.
Among the 810 randomized participants, the mean age was 52.2 years, 64.3% of the participants were male and the mean body weight was 74.7 kg. The median duration of type 2 diabetes was 5.0 years, and the mean HbA1c level at baseline was 8.60%. The baseline demographic and clinical characteristics were generally balanced across the treatment groups (Table 1).
Primary outcome
At week 32, least-squares mean changes from baseline in HbA1c under the primary non-inferiority estimand were −1.58% (95% CI: −1.73 to −1.43), −1.50% (−1.66 to −1.35) and −1.68% (−1.84 to −1.53) with safiglipron 30 mg, 60 mg and 90 mg, respectively, compared to −1.28% (−1.43 to −1.13) with dapagliflozin (Table 2). Treatment differences versus dapagliflozin were −0.30% (95% CI: −0.51 to −0.09), −0.22% (−0.44 to −0.01) and −0.40% (−0.62 to −0.19) with safiglipron 30 mg, 60 mg and 90 mg, respectively; the upper confidence limits were below the prespecified 0.4% margin for all three doses, establishing non-inferiority. Under the treatment policy estimand used for superiority testing, the differences were −0.31% (−0.49 to −0.13), −0.14% (−0.34 to 0.06) and −0.25% (−0.45 to −0.05) with safiglipron 30 mg, 60 mg and 90 mg, respectively (Table 2, Fig. 2a and Extended Data Table 1). Superiority was established for 90 mg (one-sided P = 0.0067) but not for 60 mg (P = 0.0789); the fixed sequence, therefore, stopped, and subsequent hypotheses were not confirmatory. Longitudinal changes from baseline in HbA1c through week 52 under the efficacy estimand are shown in Fig. 2b. In exploratory subgroup analyses, a nominal interaction was observed for baseline HbA1c stratum (≤8.5% versus >8.5%; global P for interaction = 0.0242), whereas results were otherwise generally consistent across prespecified subgroups (Extended Data Fig. 2).
a, Change from baseline in HbA1c at week 32 under the treatment policy estimand. Violins and points show observed data, boxes show medians and interquartile ranges and diamonds show least-squares means with 95% CIs under the treatment policy estimand. b, Least-squares mean changes from baseline in HbA1c through week 52 under the efficacy estimand, except at week 32, for which results under the primary non-inferiority estimand are shown; error bars indicate standard errors. c, Model-estimated percentages of participants achieving the three HbA1c targets at week 32 under the efficacy estimand. Bars and numerical labels show GEE-estimated marginal probabilities expressed as percentages, and error bars indicate 95% CIs. Target attainment is a binary outcome for each participant at each threshold. d, Observed mean seven-point SMBG profiles at baseline and week 32, measured before and 2 hours after each meal and at bedtime. e, Percentage change from baseline in body weight at week 32, presented as in a. f, Least-squares mean percentage changes from baseline in body weight through week 52 under the efficacy estimand; error bars indicate standard errors. In a and e, the dashed line indicates the dapagliflozin least-squares mean. Vertical dashed lines in b and f mark week 32. Treatment policy estimates in a and e used all randomized participants; the efficacy estimand in b, c and f used a hypothetical strategy for intercurrent events. Exact n values are shown in each panel and denote participants with available observed data at the indicated visit. In c, these n values are not denominators used to calculate the model-estimated percentages. Analyses used the intention-to-treat population. MMRM was used in a, b, e and f, and GEE was used in c.
Source data
Secondary outcomes
At week 32, under the efficacy estimand, estimated HbA1c target attainment rates below 7.0% were 55.7%, 54.9% and 63.5% with safiglipron 30 mg, 60 mg and 90 mg, respectively, versus 36.5% with dapagliflozin; corresponding rates at or below 6.5% were 41.4%, 38.9% and 48.6% versus 16.1% (Table 2, Fig. 2c and Supplementary Fig. 2). Treatment policy estimand analyses of target attainment are shown in Extended Data Fig. 3.
Under the efficacy estimand, the least-squares mean changes from baseline in FPG were −2.23 mmol l−1 (95% CI: −2.48 to −1.97), −2.28 mmol l−1 (−2.55 to −2.01) and −2.59 mmol l−1 (−2.86 to −2.33) with safiglipron 30 mg, 60 mg and 90 mg, respectively, as compared to −2.00 mmol l−1 (−2.24 to −1.75) with dapagliflozin (Table 2).
Body weight decreased from baseline in all groups. Under the efficacy estimand, the least-squares mean percentage changes in body weight at week 32 were −2.35% (95% CI: −2.92 to −1.78), −3.55% (−4.14 to −2.95) and −4.17% (−4.76 to −3.58) with safiglipron 30 mg, 60 mg and 90 mg, respectively, as compared to −3.60% (−4.15 to −3.05) with dapagliflozin (efficacy estimand; Fig. 2f). The estimated treatment differences versus dapagliflozin were 1.25% (95% CI: 0.46−2.04), 0.06% (95% CI: −0.75 to 0.86) and −0.56% (95% CI: −1.37 to 0.24) (Table 2). Results with the treatment policy estimand were consistent (Fig. 2e).
HOMA-derived indices were analyzed as prespecified secondary endpoints under the efficacy estimand. Geometric mean percentage increases from baseline in HOMA-β at week 32 were 76.88%, 77.98% and 98.47% with safiglipron 30 mg, 60 mg and 90 mg, respectively, versus 11.52% with dapagliflozin. HOMA-IR decreased by 16.02%, 18.90% and 22.49%, respectively, versus 38.52% with dapagliflozin (Fig. 3 and Supplementary Table 4).
a, Geometric mean percentage change from baseline to week 32 in HOMA-β. b, Geometric mean percentage change from baseline to week 32 in HOMA-IR. Analyses were done in the intention-to-treat population under the efficacy estimand using a hypothetical strategy for intercurrent events; diamonds and error bars indicate model-estimated geometric mean percentage changes and 95% CIs. Violins and points show observed data, vertical lines indicate interquartile ranges and short horizontal lines indicate medians. The dashed line and shaded band indicate the dapagliflozin estimate and 95% CI. Exact n values denote participants with available observed week 32 data contributing to the analysis.
Source data
Seven-point SMBG profiles appeared to show reductions in the mean daily, pre-meal and 2-hour post-prandial values and in glucose excursions between the pre-meal and 2-hour post-prandial values across all treatment groups at week 32 (Fig. 2d). Rescue therapy was required by three (1.5%) participants, two (1.0%) participants and one (0.5%) participant in the safiglipron 30 mg, 60 mg and 90 mg groups, respectively, whereas no participant in the dapagliflozin group required rescue therapy by week 32 (Supplementary Table 4). Waist circumference decreased across all treatment groups, generally paralleling the changes in body weight (Supplementary Table 4).
At week 32, DTSQ status version scores increased from baseline by +2.0, +1.9 and +2.2 points with safiglipron 30 mg, 60 mg and 90 mg, respectively, and by +1.6 points with dapagliflozin. Perceived hyperglycemia scores decreased from baseline with safiglipron (−1.3 to −1.5 points), similar to dapagliflozin (−1.4 points), and perceived hypoglycemia scores decreased from baseline with safiglipron (−0.2 to −0.3 points), similar to dapagliflozin (−0.3 points); full results are shown in Supplementary Table 7.
Efficacy outcomes at week 52 are shown in Supplementary Table 5 and Supplementary Fig. 1. These included model-based and observed-case analyses of glycemic measures, body weight and waist circumference, HbA1c target achievement, seven-point SMBG profiles and indices of β cell function.
Safety
Treatment-emergent adverse events (TEAEs) occurred in 188 (93.1%), 195 (96.5%) and 199 (98.0%) participants receiving safiglipron 30 mg, 60 mg and 90 mg, respectively, compared to 188 (93.1%) participants receiving dapagliflozin during the 52-week treatment period (Table 3). The most common TEAEs were gastrointestinal events, including nausea, vomiting and diarrhea, which were mostly mild to moderate in severity (Supplementary Table 8). First-onset gastrointestinal events accumulated predominantly during the dose-titration period and more slowly thereafter, whereas their daily prevalence decreased over time (Extended Data Figs. 4 and 5). Among selected TEAEs of clinical interest for SGLT2 inhibitor therapy, urinary tract infections were reported in 11 (5.4%), nine (4.5%) and 16 (7.9%) participants receiving safiglipron 30 mg, 60 mg and 90 mg, respectively, and in 12 (5.9%) participants receiving dapagliflozin. Other selected events occurred in no more than 1.5% of participants in any group, and no genital mycotic infection or dehydration was reported (Table 3).
Serious adverse events occurred in 21 (10.4%), 12 (5.9%) and 10 (4.9%) participants receiving safiglipron 30 mg, 60 mg and 90 mg, respectively, compared to 18 (8.9%) participants receiving dapagliflozin. Serious adverse events by preferred term are shown in Supplementary Table 10. TEAEs leading to permanent treatment discontinuation occurred in eight (4.0%), eight (4.0%) and eight (3.9%) participants for the safiglipron 30 mg, 60 mg and 90 mg groups, respectively, and in three (1.5%) participants in the dapagliflozin group; most were attributable to gastrointestinal adverse events in the safiglipron groups (3.0%, 3.5% and 3.4%, respectively). Detailed discontinuation events are shown in Extended Data Table 2 and Supplementary Table 11. Post hoc site-adjusted analyses did not materially alter the comparisons for treatment-related TEAEs or TEAEs leading to permanent treatment discontinuation (Supplementary Table 15).
One participant in the safiglipron 90 mg group died of acute myocardial infarction, which was considered by the investigator to be unrelated to the study treatment. Level 1 hypoglycemia occurred in 19 (9.4%), 13 (6.4%) and 18 (8.9%) participants receiving safiglipron 30 mg, 60 mg and 90 mg, respectively, and in five (2.5%) participants receiving dapagliflozin. Corresponding numbers for level 2 hypoglycemia were three (1.5%), three (1.5%), four (2.0%) and zero. No episodes of severe hypoglycemia were reported.
By week 52, hepatic transaminase levels had generally decreased from baseline across the safiglipron groups (Supplementary Table 12), and no cases met Hyʼs law laboratory criteria (Extended Data Table 3). Changes in diabetic retinopathy stage, vital signs and scheduled electrocardiographic findings through week 52 are summarized in Supplementary Tables 9, 13 and 14.
Exploratory outcomes
Cardiometabolic and renal risk markers
Under the efficacy estimand, prespecified exploratory analyses assessed changes in blood pressure, lipid parameters and UACR at week 32. Safiglipron 90 mg was associated with reductions from baseline in triglycerides (−10.4%), low-density lipoprotein (LDL) cholesterol (−2.7%) and total cholesterol (−2.4%), whereas the effects at lower doses were less consistent (Extended Data Fig. 6). By comparison, dapagliflozin was associated with a reduction in triglycerides (−5.6%) but increases in LDL cholesterol (+2.9%) and total cholesterol (+2.3%). Safiglipron also reduced systolic blood pressure, showing −2.93 mmHg (95% CI: −4.40 to −1.46), −3.67 mmHg (−5.23 to −2.11) and −4.53 mmHg (−6.10 to −2.97) for the 30-mg, 60-mg and 90-mg groups, respectively, compared to −4.61 mmHg (−6.03 to −3.20) for dapagliflozin. All three doses reduced the UACR, with dapagliflozin-adjusted percentage differences of −24.7% (95% CI: −37.8 to −8.9), −20.4% (−34.7 to −3.0) and −28.0% (−40.9 to −12.1) for the 30-mg, 60-mg and 90-mg groups, respectively (Extended Data Fig. 6 and Supplementary Table 6).
Sensitivity analyses
The prespecified sensitivity analysis using multiple imputation followed by analysis of covariance yielded results consistent with the primary analysis. The prespecified two-dimensional tipping-point analysis identified Pareto-minimal delta pairs at which non-inferiority first failed (Supplementary Table 3).



