
Integrated genomic analysis of 423 cases with NDMM
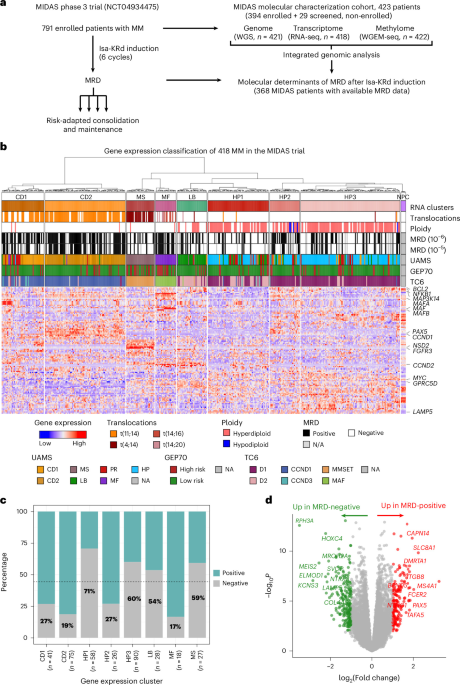
To gain a comprehensive view of molecular changes in NDMM and their association with treatment response, we analyzed 423 cases from the MIDAS trial, representing the MIDAS molecular characterization cohort (Fig. 1a), using whole-genome sequencing (WGS), RNA sequencing (RNA-seq) and whole-genome enzymatic methylation sequencing (WGEM-seq). Although all 423 patients were screened for the MIDAS trial, 394 were ultimately enrolled (Supplementary Fig. 1). Consequently, all 423 patients were included in the baseline molecular characterization, whereas molecular predictors of MRD were evaluated exclusively among enrolled patients. The main clinical characteristics of the cohort are provided in Extended Data Table 1. Baseline characteristics were comparable between patients with and without available multiomic data, except for a modest enrichment of higher International Staging System29 (ISS) stages and greater bone marrow plasma-cell burden in the multiomic subset, which is consistent with the requirement for sufficient CD138-positive plasma cells for multiomic profiling. No significant differences were observed between patients with and without MRD assessment (Extended Data Table 2). After stringent quality controls (Methods, Supplementary Figs. 2 and 3 and Supplementary Tables 1–3), we obtained 421 WGS (mean depth 46X for tumor DNA, 27X for normal DNA), 418 RNA-seq (mean 66 M read pairs per sample) and 422 WGEM-seq (mean depth 13X) profiles, with all 3 data types available for 416 samples. Five normal plasma cell (NPC) samples were also analyzed using RNA-seq and WGEM-seq to provide reference gene expression and DNA methylation landscapes.
a, Workflow of the MIDAS genomic ancillary study. b, Gene-expression-based classification of the cohort (n = 418). The heatmap displays scaled gene expression values; the annotation tracks indicate molecular features including translocations, ploidy and MRD status. Each tumor was also annotated according to the University of Arkansas Medical Sciences (UAMS) gene expression groups, GEP70 risk status and TC6 classification. c, Association between molecular subgroups and postinduction MRD at 10−6. The percentage of MRD-negative cases is indicated in each bar. d, Volcano plot showing DEGs between postinduction MRD-positive and negative cases. Differential expression analysis was performed using edgeR and limma. Raw counts were trimmed mean of M-values-normalized, transformed with voom and analyzed using linear modeling with empirical Bayes moderation. Benjamini–Hochberg correction was used for multiple testing correction. Genes with an FDR < 0.05 and abs(log2(fold change)) > 1) were considered significantly differentially expressed. The red dots denote upregulated and the green dots downregulated genes. NA, not applicable; N/A not available.
Gene expression groups exhibit heterogeneous responses to quadruplet induction
Unsupervised classification of the samples based on their gene expression profiles revealed eight molecular groups, strongly associated with genomic alterations (Fig. 1b) and matching previously described transcriptomic subgroups13 (Supplementary Fig. 4 and Supplementary Table 4). Driver translocations activating NSD2, MAF/MAFA/MAFB and CCND1 defined the MS, MF and CD expression groups respectively (Supplementary Table 5), with the CD group being split into CD1 and CD2, as described previously13. We identified three subgroups of hyperdiploid tumors (HP1–HP3), all expressing the core HP signature but with distinct features: HP1 exhibited a proliferative program with overexpression of CCND2 and E2F targets; HP2 expressed B cell identity genes (PAX5, MS4A1, VPREB3), resembling CD2; and HP3 overexpressed inflammatory chemokines and tumor necrosis factor and interferon pathway genes (Supplementary Table 6 and Supplementary Fig. 5). The last group displayed a signature consistent with the low-bone (LB) subgroup. In contrast to prior reports, we did not identify a distinct proliferation (PR) subgroup originally described in ref. 13 Instead, PR scores displayed a continuous, unimodal distribution, with high PR scores observed across multiple transcriptional clusters (Supplementary Fig. 4).
MRD after induction, available for 368 of the 394 enrolled patients, was negative for 44.8% at 10−6 (59.8% of patients at 10−5), with marked differences across molecular groups (P = 1.9 × 10⁻¹⁰, logistic regression, likelihood ratio test (LRT), false discovery rate (FDR)-adjusted), which remained significant after adjustment for clinical covariates (Supplementary Table 7). The CD2 and MF groups displayed the lowest MRD-negativity rates, which were highest in the HP1, HP3 and MS groups (Fig. 1c). Although longitudinal analyses indicated partial convergence of MRD-negativity rates between after induction and before maintenance, the overall association between expression subgroup and MRD remained significant at the pre-maintenance stage (P = 2.0 × 10⁻⁷, LRT), with a similar ordering across expression groups (Supplementary Fig. 6). Direct differential expression analysis comparing MRD-positive and MRD-negative cases revealed 170 genes upregulated in MRD-positive samples (FDR-adjusted P < 0.05, log2(fold change) > 1), including driver genes CCND1 and MAFA, and multiple genes associated with B cell differentiation like PAX5 (Fig. 1d). In MRD-negative cases, 217 genes were upregulated, enriched for epigenetic modifiers, vesicle trafficking and exocytosis genes, cell proliferation regulators and MYC targets (Supplementary Table 8 and Supplementary Fig. 7).
These key pathways were differentially distributed across transcriptomic subgroups. The B cell differentiation program was highly expressed in the CD1/CD2 and HP2 groups, characterized by lower MRD-negativity rates. The MYC pathway was activated in the highly MRD-responsive HP1/HP3 subgroups, but also in the MF group, which is consistent with the highest MYC alteration frequencies observed in these groups (Supplementary Fig. 8). The proliferation signature displayed substantial heterogeneity across subgroups. Of note, MYC activity and proliferation scores were strongly correlated, and inversely correlated with the B cell differentiation score (Supplementary Fig. 8). To assess their contribution to MRD response beyond subgroup structure, we fitted nested logistic regression models, including subgroup and pathway scores (Supplementary Table 9). Inclusion of pathway scores significantly improved model fit (P = 6.1 × 10⁻⁴) and partially attenuated the association between subgroup and MRD (20.6% reduction in likelihood ratio, chi-squared test), indicating that these programs account for a fraction of subgroup-associated differences in MRD response. However, most of the subgroup effect remained after adjustment. Importantly, these pathway associations were also observed within specific expression groups (Supplementary Fig. 9).
Together, these results indicate that differentiation state and proliferative capacity define a proliferative versus B cell-like transcriptional axis that underlies both transcriptomic subgroups and MRD response within subgroups. Subgroup-stratified analyses revealed broadly consistent MRD-associated transcriptional changes across molecular groups, although some clusters (for example, MS) showed limited concordance, suggesting potential subgroup-specific mechanisms that will require larger cohorts to resolve (Supplementary Table 8 and Supplementary Fig. 10).
To validate the transcriptomic features associated with postinduction MRD, we analyzed RNA-seq data from 257 patients enrolled in the CASSIOPEIA trial who received quadruplet induction30. Despite differences in induction regimens between CASSIOPEIA (four cycles of daratumumab, bortezomib, thalidomide and dexamethasone (D-VTd)) and MIDAS (six cycles of Isa-KRd), several key findings were reproduced (Supplementary Fig. 11). Specifically, CCND1 overexpression and the CD1/CD2 subgroups were associated with MRD positivity in CASSIOPEIA, whereas the HP1 subgroup was associated with MRD negativity. Moreover, differentially expressed genes (DEGs) and pathways associated with MRD in CASSIOPEIA closely recapitulated those identified in MIDAS, with CD1/CD2 and immature B cell differentiation signatures associated with MRD positivity, and MYC and proliferation signatures associated with MRD negativity. These results demonstrate the reproducibility of the major transcriptomic determinants of MRD response across independent clinical trials.
Genomic instability phenotypes and their association with postinduction MRD
WGS revealed a median of 9,360 somatic mutations (80 coding) and 26 structural variants (SVs) per MM, which is consistent with previous reports6,12. The mutation burden differed significantly between molecular groups (P = 1.3 × 10⁻⁵, Kruskal–Wallis test), with the MF group displaying the highest mutation burden (median = 13,132 mutations) because of a high activity of APOBEC signatures (Fig. 2a, Supplementary Fig. 12 and Supplementary Table 10). The number of SVs also differed (P = 1.4 × 10⁻¹⁴, Kruskal–Wallis test), being highest in the MF and MS groups (median > 50 SVs) and lowest in CD1/CD2 (median = 17 SVs). Chromothripsis was detected in 16% of MM and was significantly more prevalent in the MF (50%) and MS (33%) groups, explaining their higher SV load (Supplementary Fig. 13). Chromosomal instability, measured using fraction of aberrant genome (FAG) was highest in HP as expected (>40%) and lowest in CD1/CD2 (10.8%, P = 1.0 × 10−49, Kruskal–Wallis test).
a, Mutation, SV and CNA burdens differ between molecular subgroups. Box plots show the median (center line), first and third quartiles (box bounds), and the smallest and largest values within 1.5 times the interquartile range (IQR) (whiskers); dots represent individual samples, including values beyond the whiskers. The numbers in parentheses indicate the number of samples in each molecular group. b, ID2 and SBS6 mutational signature identify MSH2-related mismatch repair deficiency in rare MM cases. Differences in signature activity between samples with and without MSH2 mutations were assessed using two-sided Wilcoxon rank-sum tests. c, Circos plots showing the genomic alteration profiles of two representative tumors for the SV2 (scattered translocations, left) and SV3 (focal deletions, right) signatures. Copy-number changes are displayed in the outer circle and SVs (deletions, inversions, tandem duplications and translocations) in the inner circle. d, Deletion of the SV3 signature is related to frequent monoallelic and rare biallelic BRCA2 inactivation events. The violin plots show the distribution of SV3 events according to BRCA2 status, with dots representing individual samples, colored according to BRCA2 alteration type. The ordered association between BRCA2 alteration status and SV3 activity was assessed using a two-sided Jonckheere–Terpstra trend test. e, Genomic instability features associated with MRD after Isa-KRd induction. APOBEC-high tumors were defined as those having more than 2,000 SBS2 + SBS13 mutations. Statistical significance was assessed using LRTs with Benjamini–Hochberg FDR correction; FDR-corrected P values are indicated. ID, small insertion/deletion signatures.
We next investigated cases with MM with atypical genomic instability phenotypes. Ten tumors exhibited exceptionally high mutation burdens (>25,000 somatic mutations), 8 of which were APOBEC-driven (Supplementary Fig. 12). The remaining 2 harbored more than 48,000 indels (cohort median = 2,160) featuring the COSMIC ID2 signature associated with mismatch repair deficiency (MMRd) (Supplementary Fig. 14). Both samples also showed the MMRd-associated single-base substitution 6 (SBS6) signature. One carried a germline MSH2Q339* variant with loss of the wild-type (WT) allele through copy-neutral loss of heterozygosity (Supplementary Fig. 15). The other had a somatic MSH2K675E mutation located in the adenosine diphosphate-binding domain and predicted to be highly pathogenic (evolutionary model of variant effect score = 0.92)31. A third tumor carried a somatic MSH2L481V variant predicted to be benign (evolutionary model of variant effect = 0.36) and did not display MMRd-associated mutational signatures. No other sample showed a significant contribution of the ID2 or SBS6 signatures. Across the cohort, the presence of ID2 and SBS6 signatures was significantly associated with MSH2 mutations (Fig. 2b), suggesting that MSH2-associated MMR deficiency may represent a rare mutational process in MM.
SV analysis identified four distinct SV signatures (SV1–SV4) (Supplementary Fig. 16 and Supplementary Table 11). SV4 corresponded to the well-known chromothripsis/chromoplexy pattern, characterized by many clustered SVs9,12. SV2, marked by scattered interchromosomal translocations (Fig. 2c), was highly active (>150 events) in 3 patients without evidence of shared driver alterations or DNA repair defects. While the underlying mechanism is unclear, manual inspection of representative events (Supplementary Fig. 17) supports that SV2 represents a bona fide SV signature of unknown etiology. SV3, defined by focal deletions (<1 megabase (Mb), peaking below 1 kilobase (kb)), resembled the deletion signature associated with BRCA2-deficient breast cancers32.
The BRCA2 gene, located on the 13q arm, is frequently deleted in MM; recurrent mutations have also been described2. In our cohort, BRCA2 exhibited monoallelic inactivation in 200 cases (47.5%, mostly due to 13q deletions) and biallelic inactivation in 8 (1.9%), through homozygous deletion or combined mutation and deletion. SV3 activity correlated significantly with BRCA2 alteration status (P = 4.9 × 10⁻⁷, Jonckheere–Terpstra test; Fig. 2d). Notably, the only case with MM with more than 100 SV3 events harbored a germline-truncating BRCA2 mutation (T1858fs) with deletion of the WT allele (Supplementary Fig. 18).
We validated the presence of this focal deletion signature, and its association with BRCA2 alterations, in the MMRF cohort8 (Supplementary Fig. 19). We further quantified additional signatures associated with homologous recombination deficiency (HRD), including SBS3, the number of large microhomology-mediated indels and the copy-number-based large-scale transition and HRD scores. All these metrics were significantly associated with BRCA2 status in MIDAS (Supplementary Fig. 19). Together, these data reveal genomic signatures consistent with HRD in MM, associated with rare biallelic inactivation and frequent monoallelic BRCA2 loss via 13q deletion.
Finally, we evaluated the relationship between genomic instability and postinduction MRD status. Higher FAG was strongly associated with MRD negativity (FDR-adjusted P = 2.9 × 10⁻⁵, LRT) (Fig. 2e), which is consistent with the high MRD-negativity rates observed in the HP1/HP3 groups. Although overall mutation burden was not associated with MRD, SBS9 (activation-induced cytidine deaminase activity; FDR-adjusted P = 5.5 × 10⁻⁵) and SBS18 (oxidative DNA damage; FDR-adjusted P = 7.9 × 10⁻⁵) were associated with MRD negativity. In contrast, APOBEC-high tumors (>2,000 SBS2 + SBS13 mutations) largely overlapped with the MF group (15 of 18 cases) and were associated with MRD positivity (FDR-adjusted P = 0.015). All associations remained significant after adjusting for clinical variables (Supplementary Table 7). The number of SVs was not associated with MRD, whereas chromothripsis showed a trend toward association with MRD positivity (FDR-adjusted P = 0.099).
WGS reveals new driver genes in MM
We next leveraged this large multiomic cohort to identify new driver genes in MM. A dN/dS analysis revealed 25 genes with significantly more damaging mutations than expected by chance, most of which were previously implicated in MM2,12 (Supplementary Table 12). Rare but significantly recurrent mutations notably involved the histone linker H1.4, mutated in 14 patients (3.3%). Most mutations clustered within the highly conserved globular domain (Supplementary Fig. 20) and may promote oncogene expression through disruption of higher-order chromatin organization, as reported in B cell lymphomas33. The ribosomal protein RPL10, mutated in ten patients (2.4%), featured hotspot variants (E66A/Q, I70L and R210W) distinct from the canonical R98S mutation reported in T cell acute lymphoblastic leukemia34. In T cell acute lymphoblastic leukemia, RPL10 mutations alter translational control, including enhanced translation of specific pro-survival proteins35. The distinct hotspot mutations encountered in MM may exert similar context-specific effects on the translatome.
To identify new oncogenes activated by SVs, we systematically screened genes with recurrent SV breakpoints associated with significant overexpression. This approach highlighted ten significant genes (FDR-adjusted P < 0.05, fold change > 2), including eight known translocation targets and two potential new oncogenes: IRAK1 and FOXR1 (Fig. 3a, Supplementary Table 13 and Supplementary Fig. 21).
a, Genes with significant SV-associated gene expression changes. Observed P values for differences in gene expression between samples with and without proximal SVs are plotted against the expected P values under the null hypothesis. Genes with significant SV-induced overexpression are shown in red. b,c, IRAK1 (b) and FOXR1 (c) expression in samples with and without proximal SV. Sample numbers (n) for each group are indicated in parentheses. The box plots show the median (center line), first and third quartiles (box bounds), and the smallest and largest values within 1.5 times the IQR (whiskers); the dots represent individual samples (including values beyond the whiskers) and are colored according to SV type. a–c, Expression differences between samples with and without proximal SVs were assessed using two-sided Wilcoxon rank-sum tests. P values were adjusted across the genes tested using the Benjamini–Hochberg FDR procedure. Exact P values are reported on the panels while FDR-adjusted P values are provided in Supplementary Table 13. d, Rearrangements leading to the overexpression of FOXR1. Shown are the junctions identified in WGS. Fusion transcripts and predicted fusion proteins are represented in Supplementary Fig. 21. e, Oncoprint showing the driver alteration landscape in the MIDAS cohort. Rows represent genes and columns represent samples. Alterations, including mutations, CNAs and SV, are indicated with a color code as shown in the figure legend. f, Various genomic alterations inducing MYC overexpression in the MIDAS cohort. The violin plots show MYC expression distribution across tumors with different MYC alterations, with dots representing individual samples. Each MYC-altered group was compared with the unaltered group using a two-sided Wilcoxon rank-sum test. g, The number of driver alterations correlated with postinduction MRD. h, Driver genes associated with differential postinduction MRD. Statistical significance was assessed using LRTs with FDR correction.
IRAK1, a kinase downstream of Toll-like and interleukin-1 receptors, has been reported as an oncogene and therapeutic target in multiple hematological and solid tumors (myelodysplastic neoplasms, lymphoma, acute myeloid leukemia, breast cancer), where it sustains NF-κB-driven inflammation, tumor cell survival and therapy resistance36,37,38,39. In our cohort, 15 cases with MM (3.6%) displayed SV breakpoints within 1.5 Mb of IRAK1, associated with significant overexpression (FDR-adjusted P = 0.0067, fold change = 3.6) (Fig. 3b). To validate these findings, we analyzed the independent MMRF cohort8 (779 MM with matched WGS and RNA-seq), identifying 57 cases (7.3%) with IRAK1-proximal SVs and consistent overexpression (P = 6.2 × 10⁻⁷; fold change = 2.1). Notably, the two tumors with the highest IRAK1 expression harbored translocations involving immunoglobulin heavy chain (IGH) or immunoglobulin light chain loci (Supplementary Fig. 22).
FOXR1, a forkhead transcription factor, is aberrantly activated by intrachromosomal SVs in B cell lymphoma and neuroblastoma, promoting proliferation and inhibiting apoptosis40,41. In the MIDAS cohort, six cases with MM (1.4%) harbored intrachromosomal inversions leading to massive FOXR1 overexpression (FDR-adjusted P = 0.0050, fold change = 490, mean transcripts per million (TPM) = 9.4) whereas FOXR1 expression is nearly undetectable in cases with MM without such rearrangements (mean TPM = 0.006) (Fig. 3c). These inversions juxtapose the FOXR1 promoter, normally located in quiescent chromatin, with active chromatin regions (defined in the GM12878 cell line), resulting in fusion transcripts with the highly expressed DDX6 (n = 4) and RPS25 (n = 2) genes. (Fig. 3d and Supplementary Table 14). Such fusions, which preserve the full-length FOXR1 protein (Supplementary Fig. 23), were previously reported to induce FOXR1 dependency in cancer cell lines42. Similar FOXR1 alterations were identified in the MMRF8 (n = 3), MANHATTAN7 (n = 1) and CASSIOPEIA (n = 7) cohorts, including fusions involving additional partner genes such as PAFAH1B2, UBE4A, ARCN1, HINFP and KMT2A, also associated with marked FOXR1 overexpression (Supplementary Fig. 22).
Comprehensive landscape of driver alterations and their association with MRD
To generate a comprehensive landscape of driver events in MM, we compiled all the genetic alterations identified in known MM driver genes and the new candidates identified above (Fig. 3e, Supplementary Fig. 24 and Supplementary Table 15). A median of four driver alterations per sample were identified when integrating mutations, SVs and focal CNAs. Driver translocations involving Ig loci were identified in 192 cases (46%). While IGH was the most frequent partner for CCND1, NSD2 and MAF, MYC was activated through a diversity of translocation events (Supplementary Fig. 25). In addition to IGH (t(8;14)), recurrent MYC partners included IGL (t(8;22)), IGK (t(2;8)) and TENT5C (t(1;8)), all resulting in significant MYC overexpression (Fig. 3f). Other MYC translocations with nonrecurrent partners were frequent and also induced overexpression (P = 9.5 × 10⁻⁶, Wilcoxon rank-sum test). Considering all events, MYC was the second most frequently altered gene in our cohort (26%), whereas only 5% displayed the canonical t(8;14) translocation. Similarly, in the MF molecular group, only 14 of 22 cases were explained by canonical t(14;16) or t(14;20) translocations. Other events activating MAF, MAFA or MAFB included t(1;16), t(1;8) and t(1;5;20), linking these transcription factors with the TENT5C locus (Supplementary Fig. 25). These results underscore the value of integrating genome and transcriptome data to uncover rare driver events beyond canonical translocation events.
The number of driver alterations was significantly higher in patients who achieved MRD negativity (FDR-adjusted P = 0.024, LRT) (Fig. 3g). Considering individual driver genes, CCND1 alterations were associated with a lower rate of MRD negativity after induction (FDR-adjusted P = 5.6 × 10⁻⁷) (Fig. 3h). In contrast, alterations in MYC (FDR-adjusted P = 2.5 × 10⁻⁴), TXNDC5 (FDR-adjusted P = 0.0064) and BRAF (FDR-adjusted P = 0.0098) were associated with higher rates of MRD negativity. These associations remained significant after adjustment for clinical variables, with the exception of the number of driver alterations (Supplementary Table 7).
DNA methylation-based classification of MM
We next analyzed the WGEM-seq data, providing genome-wide DNA methylation profiles, to investigate epigenetic alterations and heterogeneity in MM. DNA-methylation-based classification identified nine distinct methylation groups (M1–M9) that were strongly associated with genomic and transcriptomic features (P < 2.2 × 10⁻¹⁶, chi-squared test) (Fig. 4a and Supplementary Table 16), with no significant association with patient age (P = 0.065, Kruskal–Wallis test) (Supplementary Fig. 26). M1 and M4 closely corresponded to the MF and MS transcriptomic groups, respectively. Tumors harboring t(11;14) rearrangements clustered into M2 and M3. These methylation-based subgroups showed major overlap with the CD1/CD2 transcriptomic subtypes at the cohort level, yet within t(11;14), the methylation and expression partitions remained distinct. Similarly, hyperdiploid tumors were distributed across M6–M9, partially aligning with, yet diverging from, the HP1–HP3 clusters. M5 included NPCs and MM samples exhibiting a normal-like methylation profile, which may partly reflect lower tumor purity in a subset of cases (Supplementary Fig. 26).
a, Hierarchical clustering revealed nine DNA methylation MM subgroups. The heatmap shows methylation beta values for the 30,000 most variable CpG features. b, Number of hypermethylated and hypomethylated features in each group with respect to NPCs. c, Distribution of methylation levels in different types of chromatin regions. d, Association of DNA methylation groups with MRD. The bar plots show MRD-negativity rates with 95% confidence intervals (CIs). BivDmns, bivalent domains; Enh, enhancer; Het, heterochromatin; Quies, quiescent chromatin; ReprPC, Polycomb-repressed regions; Tx, transcribed region; ZNF/Rpts, zinc finger/repeat regions.
Differential methylation analysis showed widespread hypomethylation across all MM subgroups compared with NPCs (Fig. 4b), predominantly affecting quiescent chromatin, Polycomb-repressed domains and heterochromatin (Fig. 4c). The M2 subgroup of t(11;14) and the M7–M9 hyperdiploid subgroups exhibited the most extensive hypomethylation, with both a higher number of affected regions and larger decreases in methylation levels compared to the other groups. In contrast, active regulatory elements, including transcription start sites (TSS) and enhancers, showed fewer DNA methylation changes, with more balanced and subgroup-specific patterns of hypermethylation and hypomethylation.
Finally, MRD analysis revealed significant differences across methylation groups (FDR-adjusted P = 6.7 × 10⁻¹¹, LRT). M1–M3 (aligned with MF and CD1/CD2) and M5 were associated with lower MRD-negativity rates, whereas M4 (MS) and the hyperdiploid subgroups M7 and M9 were linked to higher MRD negativity (Fig. 4d). The association between methylation groups and MRD remained significant after excluding M5 or after adjustment for tumor purity and mutation burden (FDR-adjusted P < 1.5 × 10⁻⁹, LRT).
Oncogenic translocations induce local and genome-wide methylation changes
Driver translocations activate oncogenes by placing them under the control of IGH locus super-enhancers. This results in the spreading of active chromatin marks; however, the consequence on local DNA methylation is unknown. In this study, we observed a widespread hypomethylation of all translocated oncogenes (NSD2, CCND1, CCND3, MAF, MAFB and MYC) resulting from their juxtaposition with Ig loci (Fig. 5a–d and Supplementary Fig. 27). This hypomethylation extended across most of the gene body and, in the case of NSD2, was strongly correlated with gene expression (Fig. 5b). Thus, driver translocations induce cis-acting DNA hypomethylation that may fine-tune the overexpression of target oncogenes.
a, Heatmap showing the methylation profiles at the NSD2 locus in 422 MM grouped according to DNA methylation subgroup. b, Correlation between NSD2 gene body methylation and expression in 417 MM and 5 NPC with both WGEM-seq and RNA-seq data, colored according to gene expression cluster. Association between gene body methylation and gene expression was assessed using a two-sided Pearson correlation test. The Pearson correlation coefficient (r) and unadjusted P value are indicated. The dashed line represents linear regression fits and the shaded band indicates its 95% CI. c, Heatmap showing the methylation profiles at the CCND1 locus in 422 MM grouped according to DNA methylation subgroup. d, Correlation between CCND1 gene body methylation and expression in 417 MM, colored according to gene expression cluster. The association between gene body methylation and gene expression was assessed using a two-sided Pearson correlation test. The Pearson correlation coefficient (r) and unadjusted P value are indicated. The dashed line represents linear regression fits and the shaded band indicates its 95% CI. e, Number of genes with expression significantly correlated (positively or negatively) with their promoter or gene body methylation. f, Distribution of correlation coefficients between promoter methylation and gene expression for genes whose methylation was significantly correlated (positively or negatively) with expression. g, Same for gene body methylation. h, Correlation of gene expression and gene body methylation changes in the M4 subgroup compared with other MM. Red dots indicate genes showing significant overexpression and gene body hypermethylation. i, Heatmaps showing the gene body methylation and expression of KRAS signaling genes overexpressed and hypermethylated in the M4 subgroup.
To identify DNA methylation changes with potential regulatory relevance, we examined correlations between gene expression and both promoter (TSS ± 500 bp) and gene body methylation across 417 MMs with paired data (Fig. 5e–g). As expected, promoter methylation was predominantly negatively correlated with gene expression (2,831 genes). However, the most extensive association between DNA methylation and gene expression in MIDAS was observed in gene bodies, where methylation was positively correlated with gene expression (n = 6,677 genes). For example, in the M4 group corresponding to t(4;14) tumors, gene expression changes were highly correlated with gene body methylation (Fig. 5h). Genes showing concurrent overexpression and gene body hypermethylation were significantly enriched for KRAS signaling (P = 0.0014) (Fig. 5i). They also included several oncogenes, notably transcription factors (FOXA1, KLF4, PRDM16, STAT5B, TBX3) and signaling components (ALK, FGFR1, FLT4, CARD11, GNAQ), which may contribute to transcriptional reprogramming and aberrant proliferative signaling in this subgroup (Supplementary Fig. 28).
Altogether, our results indicate that driver translocations in MM induce local hypomethylation linked to target oncogene overexpression, and broader methylation changes that reshape the transcriptome and reinforce oncogenic programs.
Multimodal predictor of postinduction MRD
With this multiomic study, we provided an integrated characterization of genomic, transcriptomic and epigenomic features in the MIDAS cohort (Supplementary Table 17). Across the full cohort, 20 features were significantly associated with MRD status (FDR-adjusted P < 0.05, LRT), spanning global genomic features, driver alterations, mutational signatures and transcriptomic and methylation subgroups (Fig. 6a). Significant correlations were observed across variables from different omics, reflecting distinct molecular features of the same biological entities (Supplementary Fig. 29). For example, MAF alterations were tightly linked to the MF transcriptomic group, the M1 methylation group and APOBEC mutational signatures. These full-cohort associations were not used for feature selection in subsequent predictive modeling.
a, Forest plot of features associated with MRD. Points indicate the odds ratio (OR) estimates and the error bars indicate the 95% CIs. Continuous variables are shown as ORs per 1 s.d. increase; binary genomic features are shown as ORs for presence versus absence; expression and methylation clusters are shown as one-versus-rest comparisons. The analyses included 366 samples with available WGS and MRD data for genomic variables, 363 samples with available RNA-seq and MRD data for transcriptomic variables and 367 samples with available WGEM-seq and MRD data for methylation variables. Statistical significance labels correspond to LRT P values adjusted for multiple testing as reported in Supplementary Table 7. b, Workflow used to develop and validate a multimodal MRD predictor in the MIDAS trial. c, Receiver operating characteristic curves showing the performance of random forest models using single-omic or combined multiomic data in the held-out validation set. d, Performance of single-omic, multiomic and clinical random forest models in the held-out validation set (n = 120 patients). Each bar represents the area under the curve (AUC) obtained from each model, with the error bars indicating the 95% CIs. P values indicate statistically significant differences between AUCs, assessed using a two-sided DeLong test. e, Validation of predicted MRD values in the held-out validation set using the multiomic random forest model, shown as a contingency table comparing predicted and true MRD status. Model accuracy was compared with the no-information rate (NIR) using a one-sided exact binomial test.
To generate a multimodal predictor of postinduction MRD, we divided the 361 patients with complete multiomic data and MRD status into training (two-thirds, n = 241) and held-out validation (one-third, n = 120) sets. We implemented a nested cross-validation framework within the training set, in which feature screening, hyperparameter tuning and model training were performed independently within each outer fold to prevent information leakage (Fig. 6b). This approach yielded an out-of-fold AUC of 0.72 (95% CI = 0.65–0.78), providing an unbiased estimate of internal performance during model development. A final ‘locked’ random forest model was then trained on the full training set and evaluated in the held-out validation set.
In the held-out validation set, the multiomics model achieved an AUC of 0.77 (95% CI = 0.67–0.85), predicting MRD status with 71% accuracy (P = 5.3 × 10⁻⁴ versus no-information rate), and calibration intercept (−0.018) and slope (0.99) close to ideal values (Fig. 6c–e and Supplementary Fig. 30). The multiomics model showed higher discrimination than clinical predictors based on ISS, revised ISS (R-ISS) and high-risk cytogenetic abnormalities, as well as the genomic model (P < 0.015, DeLong test). While differences in AUC with the transcriptomic (0.73) and epigenomic (0.75) models were not significant, the multiomics model showed improved calibration metrics (Supplementary Table 18).
To assess the stability of feature selection and identify key contributors to the model, we evaluated feature stability across the outer folds of the nested cross-validation and using bootstrap resampling. A subset of features, including expression and methylation clusters, mutational signatures (SBS9, SBS18), fraction of aberrant genome and CCND1 and TXNDC5 alterations, were consistently selected across resampling procedures (Supplementary Fig. 30). Permutation importance analyses in the validation set further indicated that expression and methylation clusters, together with signature SBS18, contributed most to model performance (Supplementary Fig. 30).
Together, these results indicate that integrating multiple omic layers improves discrimination relative to clinical and genomic models, while achieving similar discrimination and better calibration than transcriptomic and epigenomic models. This analysis leverages a uniquely large, uniformly treated phase 3 cohort with matched multiomic and MRD data; accordingly, model evaluation is based on internal validation. External validation in independent cohorts will be important to assess generalizability.