
Ethical considerations
Each study siteʼs institutional review board reviewed and approved the study protocol and amendments, and all patients provided written informed consent for collection and analysis of biospecimens. The study was executed in accordance with the Declaration of Helsinki and in accordance with International Conference on Harmonization Good Clinical Practice guidelines. Patients in the studies did not receive compensation for their participation. All eligible patients were at least 18 years of age.
Patients and endpoints
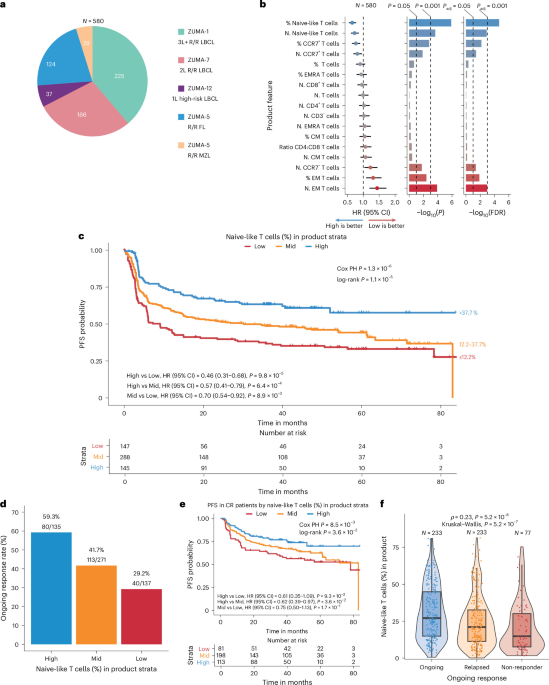
Product samples from 225 patients in ZUMA-1 (NCT02348216; 227 dosed)51,52,53,54,55,56, 166 patients in ZUMA-7 (NCT03391466; 170 dosed)3,57, 37 patients in ZUMA-12 (NCT03761056; 37 dosed)58,59 and 152 patients (124 with FL, 28 with MZL) in ZUMA-5 (NCT03105336; 152 dosed)7,60 were included in the cross-study product phenotyping analysis for the discovery cohort. ZUMA-1 evaluated patients with R/R LBCL including diffuse LBCL (DLBCL), primary mediastinal B cell lymphoma (PMBCL) and transformed follicular lymphoma (tFL) treated with axi-cel in the third-line setting. In ZUMA-7, patients with R/R LBCL, including DLBCL and high-grade B cell lymphoma (HGBCL), were treated with axi-cel in the second-line setting. Patients with high-risk LBCL received axi-cel as first-line therapy after incomplete initial treatment (two cycles of chemoimmunotherapy) in ZUMA-12. ZUMA-5 enrolled patients with R/R indolent NHL, including FL and MZL.
In the discovery meta-cohort, we included ZUMA-1 cohorts 1, 2, 3, 4 and 6. Cohorts 1 and 2 were the pivotal cohorts; cohorts 3, 4 and 6 represented the safety management cohorts. ZUMA-1 cohort 3 investigated the use of the IL-6 receptor-blocking antibody tocilizumab and the anti-convulsant levetiracetam51. ZUMA-1 cohorts 4 and 6 incorporated earlier corticosteroids and/or tocilizumab on the incidence and severity of CRS and neurotoxicity, with cohort 6 also evaluating the impact of prophylactic corticosteroids53,54,55.
In the validation meta-cohort, we included 154 patients from ZUMA-2 phase 2 (P2) cohort 1 (NCT02601313; 68 dosed)61,62 and cohort 3 (NCT04880434; 86 dosed)63; 23 patients in ZUMA-6 phase 1 (P1) cohort 3 and P2 (NCT02926833; 28 dosed)64; and 26 patients in ZUMA-14 (NCT04002401; 26 dosed)65 with product data.
ZUMA-2 patients were treated with brexu-cel, an autologous CD19 CAR T cell product approved for treatment in R/R MCL after at least one prior line of therapy. Notably, the brexu-cel manufacturing process includes a T cell selection and lymphocyte enrichment step66. In ZUMA-2 P2 cohort 1 (N = 68, 2 × 10⁶ anti-CD19 CAR T cells per kg), a Bruton’s tyrosine kinase inhibitor (BTKi) was required prior to treatment with brexu-cel61,62. ZUMA-2 P2 cohort 3 (N = 86, 2 × 10⁶ anti-CD19 CAR T cells per kg) was initiated to evaluate brexu-cel in patients with R/R MCL who had not received prior BTKi therapy63.
ZUMA-6 assessed the safety and efficacy of axi-cel (2 × 10⁶ anti-CD19 CAR T cells per kg) in combination with the anti-PD-L1 antibody atezolizumab in patients with refractory DLBCL in the third-line setting. In ZUMA-6 P1 cohorts 1 (N = 3), 2 (N = 3) and 3 (N = 6), patients received 1,200 mg per dose atezolizumab every 21 days for four doses beginning on day 21, day 14 and day 1 after axi-cel infusion, respectively. ZUMA-6 P2 patients (N = 22) were treated according to the P1 cohort 3 atezolizumab schedule, for a total of 28 patients receiving the P2 dosing regimen64. In ZUMA-14, patients with refractory LBCL were administered axi-cel (N = 26, 2 × 10⁶ anti-CD19 CAR T cells per kg) in combination with rituximab (anti-CD20 antibody) after ≥2 lines of systemic therapy65. Patients received 375 mg m−2 rituximab on day −5 prior to cyclophosphamide and fludarabine and then every 28 days from day 21 up to day 133.
All patients in both meta-cohorts underwent leukapheresis followed by a conditioning lymphodepleting regimen. Lymphodepletion protocol consisted of cyclophosphamide (500 mg m−2 d1) and fludarabine (30 mg m−2 d−1) on days −5 to −3, followed by CAR T cell infusion on day 0. Axi-cel (ZUMA-1, ZUMA-5, ZUMA-6, ZUMA-7, ZUMA-12 and ZUMA-14) and brexu-cel (ZUMA-2) target doses were 2 × 10⁶ CAR T cells per kg.
Clinical outcomes from the most recent available data cutoff per study (ZUMA-1 P1/P2 cohorts 1 and 2, 60 months56; ZUMA-1 cohort 3, 48 months51; ZUMA-1 cohort 4, 24 months54; ZUMA-1 cohort 6, 36 months55; ZUMA-7, 60 months3; ZUMA-12, 36 months59; ZUMA-5 FL and MZL, 60 months7; ZUMA-2 P2 cohort 1, 60 months62; ZUMA-2 P2 cohort 3, 18 months63, ZUMA-6 P1 cohort 3 and P2, 60 months64; and ZUMA-14, 24 months65) were used for efficacy (PFS, ongoing and complete response) and safety (CRS and neurotoxicity) analysis.
The cross-study median follow-up based on the time from infusion (or randomization for ZUMA-7) to death or to the last date known alive for the 580 patients included in the discovery meta-cohort was 41.9 months (ZUMA-1 P1/P2 cohorts 1 and 2 median follow-up was 25.8 months; ZUMA-1 cohort 3 median follow-up was 15.4 months; ZUMA-1 cohort 4 median follow-up was 54.5 months; ZUMA-1 cohort 6 median follow-up was 32.3 months; ZUMA-5 FL median follow-up was 58.4 months; ZUMA-5 MZL median follow-up was 47.8 months; ZUMA-7 median follow-up was 41.3 months; and ZUMA-12 median follow-up was 36.6 months). The median follow-up for 203 patients included in the validation meta-cohort was 27.0 months (ZUMA-2 P2 cohort 1 median follow-up was 46.5 months; ZUMA-2 P2 cohort 3 median follow-up was 26.4 months; ZUMA-6 P1 cohort 3 and P2 median follow-up was 31.1 months; and ZUMA-14 median follow-up was 25.1 months).
PFS was defined as time from CAR T cell infusion or randomization to disease progression or death. Ongoing response referred to patients who were last known to be in response by the data cutoff. Relapse included patients who achieved complete or partial response with subsequent disease progression. Non-responders were patients who achieved stable disease or progressive disease as best response. Complete response referred to a patientʼs best overall response to CAR T cell therapy as complete response or other (partial response, stable disease, progressive disease), as determined per Lugano classification.
For neurotoxicity grading, the neurological events grading scale for ZUMA-1, ZUMA-7, ZUMA-5, ZUMA-2, ZUMA-6 and ZUMA-14 was the National Cancer Institute Common Terminology Criteria for Adverse Events (CTCAE) version 4.03 and for ZUMA-12 was version 5.0. The severity of CRS was graded according to the modified criteria of Lee et al.67.
Analysis of product and apheresis material
For flow cytometry analysis, cryopreserved product samples were thawed and concentrations adjusted before transferring to a 96-well round-bottom assay plate. Singlets were identified based on forward scatter height (FSC-H) versus forward scatter area (FSC-A). Commercially available fluorochrome-conjugated antibodies included in the five-color CAR T product characterization panel were as follows: from BioLegend, CD3 Brilliant Violet 421 (BV421, 1:200, 0.05 µg per test), CD45RA (APC, 1:40, 0.015 µg per test) and CCR7 (FITC, 1:40, 1.0 µg per test); from BD Biosciences, CD8 (APC-H7, 1:20, 0.25 µg per test) and viability (7-AAD).
Within the viable cell population, T cells were defined as CD3+. The following immunophenotypic subsets were quantified as a percentage of CD3+ T cells based on staining with antibodies against the following surface proteins/markers: CD8+ (cytotoxic T cells), CCR7+CD45RA+ (naive-like T cells), CCR7+CD45RA− (central memory T cells), CCR7−CD45RA− (effector memory T cells) and CCR7−CD45RA+ (terminally differentiated effector memory T cells). Additionally, the percentage of CD4+ helper T cells was determined from the CD3+CD8− population (100 − %CD8+).
For ZUMA-1 and ZUMA-7, apheresis T cell phenotypes were calculated as a percentage of total viable T cells (CD45+CD3+) and identified using a validated assay at CellCarta with a broader panel of markers than the Kite Pharma methodology, used for product characterization. CCR7, CD45RA, CD4 and CD8 apheresis populations were used in the analysis for direct comparison to product. All phenotypes derived from flow cytometry analysis were collected from the same product or apheresis sample (one product and/or apheresis sample for each individual patient). An example gating strategy for product phenotyping is shown in Supplementary Fig. 7 and for apheresis in Supplementary Fig. 8.
The naive-like, stem cell memory-like T cell phenotype (CCR7+CD45RA+) within the product or apheresis material is referred to as naive-like, where naive is defined by the lack of antigen exposure prior to interaction with antigen-presenting cells24. These T cells are polyclonally stimulated (CD3) during manufacturing, likely representing less differentiated memory populations rather than conventional antigen-naive T cells68 and, in the product, have been variably described as either TSCM-like27,28 or naive-like T cells19.
Analysis of product and apheresis material via CyTOF
For CyTOF analysis, cryopreserved axi-cel product and apheresis samples were thawed, washed, incubated with surface antibodies, fixed/permeabilized and incubated with intracellular antibodies prior to acquisition, as previously described64.
CyTOF files (.fcs) from three 38-marker panels were cleaned by removing beads, cell debris and cell doublets prior to harmonization via the cyCombine_0.2.15 package69 of the 34 common markers assessed across all panels (Supplementary Table 4). Two CAR detection antibodies were utilized across the three panels (anti-whitlow antibody and StandardBiotools); however, no panels contained both antibodies to allow for direct comparison of the CAR detection distributions in matched samples. Analysis of the detection distributions for both antibodies pre-harmonization and post-harmonization with cyCombine demonstrated differences in the distributions. Given the differences in profiles for the two antibodies, we did not include CAR status in response assessments but maintained these antibodies in the cyCombine analysis as a single CAR marker to allow for CAR signal detection for exploratory purposes only.
After cyCombine harmonization with the 34 common markers, unsupervised clustering was performed using the CATALYST package70. CATALYST_1.24.0 used the FlowSOM_2.8.0 (refs. 70,71) method to generate 100 SOM nodes (10 × 10 grid) and further grouped into 30 meta-clusters using ConsensusClusterPlus_1.64.0 (ref. 72) for downstream analysis.
Bivariate PFS screening of clusters (represented as % of total cells per sample) and single marker positivity (% relative to CD3+CD45+) were performed utilizing Cox proportional hazards modeling with study (ZUMA-1, ZUMA-7 and ZUMA-6) included as a covariate (‘coxph’ function from the R survival _3.8-3 package). Low signal antigens, which had a median percent in CD3+ and total viable cells of less than 1%, were excluded from single marker analyses (CD14, CD16, CD19, CTLA-4, PD-L1). Each independent variable included was standardized utilizing a z-score normalization (scale in base R, with default settings). Cox regression HR and unadjusted P values were reported for clusters, and directional log10(P) values (−log10(P) if HR > 1, log10(P) if HR < 1) were reported for single marker analyses. All P values were two-sided.
Cox regression elastic net modeling (glmnet_4.1-8) of PFS with all cluster and single markers (% relative to CD3+) above the low antigen signal exclusion threshold was performed, with each independent variable standardized utilizing a z-score normalization method prior to modeling. The elastic net mixing parameter α was set to a value of 0.5, corresponding to a penalty composed of 50% L1 (least absolute shrinkage and selection operator (LASSO)) and 50% L2 (ridge) regularization. The regularization parameter λ was selected by 10-fold cross-validation. Model β coefficients were reported for features maintained in the model at the optimal λ.
The gating schema for product cell characterization in the main and validation meta-cohorts (Supplementary Fig. 6) was applied to the CyTOF data, and single markers were explored within total viable T cells (viable CD3+) and each of the four memory phenotypes defined by CCR7 and CD45RA status. The percent positivity of each marker was reported relative to T cells and within each of the four memory phenotypes.
Analysis of ferritin, CRP and LDH
Patient serum was collected at baseline (before lymphodepletion) for quantitative protein analysis. Ferritin was analyzed using the Elecsys Ferritin Roche immunoassay or the Simple Plex Ella platform (ProteinSimple; Bio-Techne); CRP was measured using the Meso Scale Discovery (MSD) V-Plex Vascular Injury Panel 2 immunoassay; and LDH was quantified at each siteʼs clinical laboratory. Ferritin and CRP outputs were generated from the average of duplicates from the same serum sample (one sample and one value per patient). The manufacturer validated each assay, and a fit-for-purpose qualification was performed at the analysis laboratory. To allow for direct comparability of ferritin and CRP between testing sites, harmonized value ranges were generated by selecting the highest lower limit of quantification (LLOQ) and the lowest upper limit of quantification (ULOQ) for each analyte; values outside these limits were reported as one half of the LLOQ, for values below this threshold, and the ULOQ value was reported in cases above this threshold.
Analysis of CAR T cells in blood
Pharmacokinetic analysis of anti-CD19 CAR T cells (cells per µl of blood) median, peak and AUC within the first 28 days was performed by quantitative polymerase chain reaction (qPCR) in peripheral blood mononuclear cells (PBMCs), as previously described9,57. The derivation for CAR T cells per µl of blood incorporates percent (%) transduction and normalization to mononuclear cell count per µl of blood, as outlined below:
% CAR+ PBMCs = % (CAR19 / actin) × % product transduction
where % (CAR19 / actin) = (CAR ng μl−1 / reference gene ng μl−1) × 100 and % product transduction is determined using flow cytometry.
CAR T cells per μl of blood = (% CAR+ PBMCs) / 100 × mononuclear cell count per μl
The average of the technical duplicates from each timepoint collected within the first 28 days after infusion (one sample and one value per patient and timepoint) was used for analysis.
Feature stratification methodology and variable categorization
Continuous variables were categorized into Low (≤25th percentile), Mid (25th−75th percentile) and High (>75th percentile) using the complete set of patients in the meta-cohort (‘quantile’ function from the R ‘stats’ package, default settings). When these variables were used for the combined univariate and multivariate PFS analyses, a transformation into ordinal categories was applied using the same approach as for the complete set of patients with all readouts available. CRS and neurotoxicity grades were also transformed into ordinal categories as Low (grade 0−1), Mid (grade 2) and High (grade 3 or higher (G3+)). Best overall response and durable response were also transformed into ordinal categories: Low (non-response), Mid (partial response) and High (complete response) and Low (non-response), Mid (relapsed) and High (ongoing), respectively.
Product attribute PFS screening analysis in the discovery meta-cohort
Bivariate screening of product features associated with PFS was performed in the discovery meta-cohort utilizing Cox proportional hazard modeling with study (ZUMA-1, ZUMA-7, ZUMA-12, ZUMA-5 FL and ZUMA-5 MZL) included as a covariate (‘coxph’ function from the R survival _3.8-3 package). Each product feature was included in the analysis as ordinal variables (Low = 1, Mid = 2, High = 3). Cox regression HR, 95% CI, unadjusted P values and Benjamini−Hochberg false discovery rate (FDR) (‘p.adjust’ function from the R ‘stats’ package with method ‘BH’) were reported. All P values were two-sided.
Kaplan−Meier representation for naive-like T cell strata with PFS
Kaplan−Meier representations (‘ggsurvplot’ function from the R survminer _0.5.0 package) of the proportion of naive-like T cells in the product strata with PFS were performed for landmark analyses wherein Cox proportional hazards regression P values were provided (represented as P*) based on the ordinal strata representation (Low, Mid, High) of the proportion of naive-like T cells. Pairwise Cox regression results, HRs, 95% CIs and P values were reported for comparisons between groups (‘coxph’ function from the R survival _3.8-3 package).
Kaplan−Meier representations of PFS by discovery meta-cohort-derived naive-like T cell strata were performed within the context of meta-cohort-derived groups (Low, Mid, High) of key baseline features (before lymphodepletion), wherein log-rank P values were reported. All P values were two-sided.
Kaplan−Meier representations of PFS in the validation meta-cohort for naive-like T cell strata utilized thresholds defined within the context of the discovery meta-cohort for Low, Mid and High classification. Similarly, strata (Low, Mid, High) for key baseline features in the validation meta-cohort were derived from the discovery meta-cohort.
Multivariate Cox regression PFS analysis
Forest plot representations (‘forest’ function from the R forestploter_1.1.2 package) were generated for the combined univariate and multivariate Cox proportional hazards regression analyses (‘coxph’ function from the R survival _3.8-3 package) of naive-like T cells, clinicopathologic features, baseline tumor and inflammatory features and CAR T cell expansion with PFS. Continuous features were transformed into ordinal representations, as defined in the Feature stratification methodology and variable categorization section; reference and dummy variables were created for categorical features. Cox regression HRs, 95% CIs and P values were reported (‘coxph’ function from the R survival _3.8-3 package). All P values were two-sided.
Interrogation of tumor characteristics, product naive-like T cells and PFS
Correlative and multivariable analyses were performed to evaluate the association between product naive-like T cells and TME prognostic covariates, including NanoString PanCancer IO 360-derived GES (B cell score, BPI, stromal and immunosuppressive index (SII) and ImmunoSign 21 (IS21)), CD19 expression (mRNA and protein H-score) and CD3+ and CD8+ cell densities and their ratio from multiplex immunohistochemistry. Pairwise relationships were assessed using Spearmanʼs correlation (‘rcorr’ function from the R Hmisc_5.1-0 package) with collinearity defined as |ρ| ≥ 0.7. Multivariable Cox proportional hazards models (‘coxph’ function from the R survival _3.5-5 package) for PFS were constructed in two predefined subsets based on data completeness: model 1 (n = 112), including naive-like T cell proportion, GES and CD19 H-score (with BPI excluded due to collinearity with B cell GES, ρ = 0.97), and model 2 (n = 55), including naive-like T cell proportion, CD8+ cell density and CD8:CD3 ratio (with CD3+ density excluded due to collinearity with CD8+ density, ρ = 0.93). Continuous variables were dichotomized using both median and optimal (best-separation) thresholds. Optimal cut was determined using the ‘surv_cutpoint’ function from the survminer_0.4.9 package with miniprop = 0.25. Cox regression HRs, 95% CIs and P values were reported. All P values were two-sided. Forest plot representations (‘forest’ function from the R forestploter_1.1.2 package) were generated for the combined univariate and multivariate Cox proportional hazards regression analyses.
Additional methods for statistical analysis
Spearmanʼs correlation testing (‘cor.test’ function from the R ‘stats’ package with method ‘spearman’) was utilized to evaluate the relationship between ordinal and continuous variables as well as comparisons between two continuous variables. This approach was utilized for the proportion of naive-like T cells in product versus the following: ordinal representation of clinical outcomes (response, CRS, neurotoxicity), the number of lines of prior therapy, the proportion of naive-like T cells in apheresis material, baseline tumor burden and systemic inflammatory biomarkers and CAR T expansion (peak or AUC). Wilcoxon rank-sum testing (‘stat_compare_means’ function in the R ggpubr_0.6.0 package with method ‘wilcox.test’) was utilized to explore associations between continuous variables and categorical variables. In all analyses performed, P values were two-sided. We considered P values less than 0.05 to be statistically significant (and referred to them as ‘significant’). When appropriate, multiple testing corrections were applied, and FDR values calculated using the Benjamini−Hochberg method were reported; see also the Product attribute PFS screening analysis in the discovery meta-cohort section.
Sex and age
Sex, self-reported at enrollment (male versus female), and age (<65 versus ≥65) were included in multivariate analyses as covariates and were also used as stratification factors, as appropriate and as reported in the Results section.
Reporting summary
Further information on research design is available in the Nature Portfolio Reporting Summary linked to this article.