
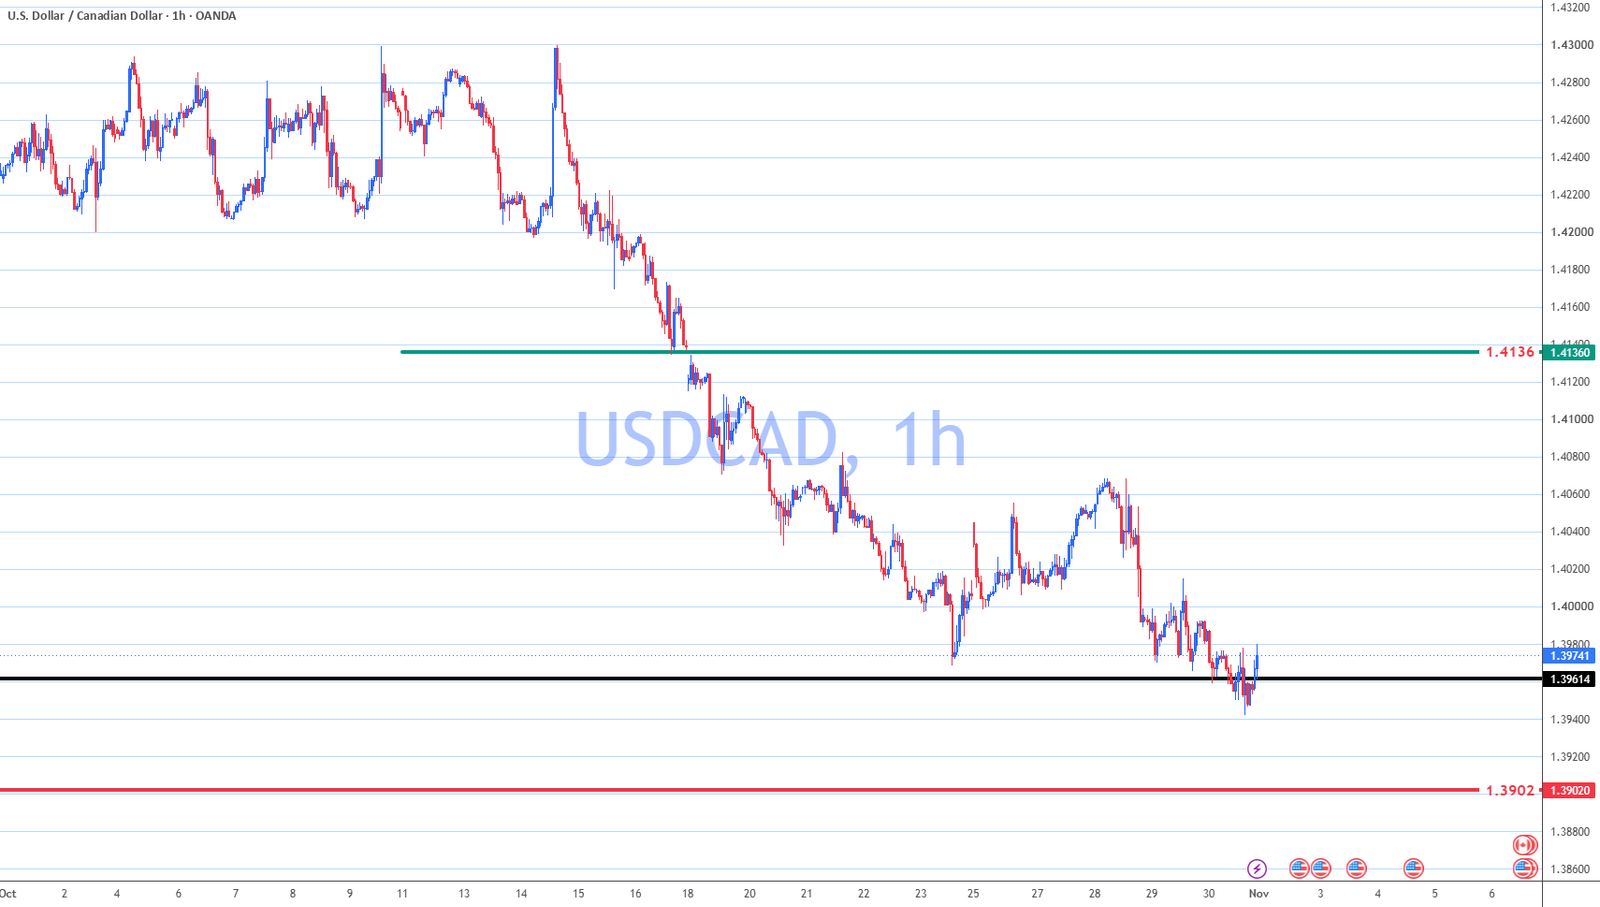
We may be getting close to a bottom. The problem? The weekly chart isn’t convinced yet. 👀
Here’s what I’m watching.
📉 Weekly Chart: Sellers Still Have the Edge
USDCAD is still moving lower, but the selling hasn’t picked up much strength.
1.3902 is the big level for me.
If we get a weekly close below 1.3902, the decline could pick up speed.
If price stays above it, I still see a chance for a recovery.
On the upside, a weekly close above 1.4136 would be a much stronger sign that buyers are taking control.
📈 Daily Chart: Could a Bottom Be Forming?
This is where things get interesting.
The recent downward wave looks close to completion, and price may be getting ready to turn higher.
But I’m not calling a bottom just yet.
I want to see a daily close above 1.4044.
That would be the first sign that buyers are making a comeback.
If price can’t clear that level, we could see a few more days of selling.
🎯 Three Levels That Matter
🔴 1.3902 — A weekly close below could open the door to more downside.
🟡 1.4044 — A daily close above would support a possible bounce.
🟢 1.4136 — A weekly close above would strengthen the case for a bigger recovery.
💭 My Take
I’m watching for a bottom, but I’m not ready to call a reversal.
The daily chart looks promising. The weekly chart is still bearish.
The next few closes could make all the difference.
What do you think?
Is USDCAD about to bounce, or is this just a pause before another drop? 👇