
Our study complies with all relevant ethical regulations. Mucosal biopsies for bulk RNA-seq and blood for proteomics from the VARSITY trial were obtained during the original clinical trial. Mucosal biopsies for CITE-seq and CosMx spatial single-cell transcriptomics were obtained through the Northwestern Digestive Health Institute Advisory Council IBD Biorepository, approved by the Northwestern University Institutional Review Board (STU00203172). Mucosal biopsies for bulk RNA-seq from the longitudinal cohort were obtained through the University of Kiel, approved by the ethics committee of the Christian-Albrechts-Universität zu Kiel (A 124/14 and AZ 156/03-2/13). Donors provided written informed consent for the use of their samples and associated data in the present study, including sharing of data, before sample collection and analysis. Appropriate protocols governing sample use were reviewed and approved by the respective institutional review boards listed above before conduct of experiments. Sex and/or gender were not considered in the design of the study.
Response trajectories and PRO-2-defined subgroups
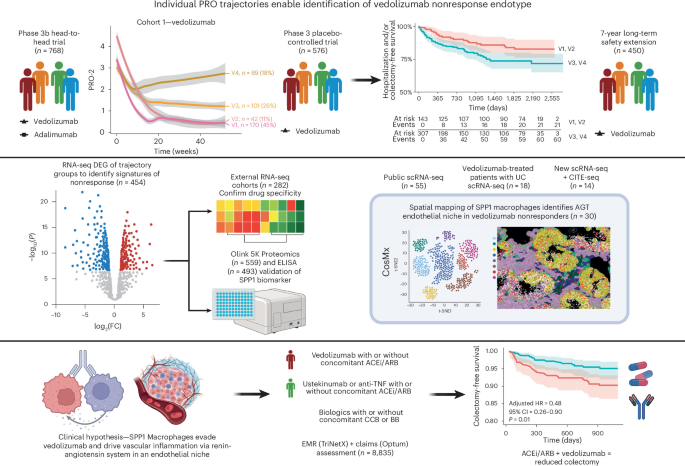
The VARSITY trial (cohort 1) is a double-blind, double-dummy, controlled study in which 769 patients with moderately to severely active UC were randomized to receive vedolizumab or adalimumab15. Data from patients who received vedolizumab treatment in the GEMINI 1 trial (cohort 2; n = 591), where the drug was examined against placebo, were used for replication16. Longitudinal PRO-2 data (rectal bleeding and stool frequency from the adapted partial Mayo score) were extracted for trajectory modeling using the GBMT R package14, with models being fitted separately for each drug using established criteria and metrics85. The four-group structure for vedolizumab was replicated in cohort 2 (GEMINI 1). The long-term safety (LTS) data from the GEMINI 1 trial (n = 450) were used for further validation that our response-trajectory subgroups predicted long-term disease outcomes86. Baseline demographics, outcome definitions and clinical outcomes from these datasets have previously been published, with comparability in disease characteristics across trials15,16,86.
Molecular transcriptomic analyses to define vedolizumab-specific endotypes
Colonoscopy-derived or sigmoidoscopy-derived biopsies were collected for VARSITY, GEMINI 1 and GEMINI LTS with standardized collection protocols. Illumina strand-specific RNA-seq with rRNA depletion libraries were prepared and sequenced with 150 bp paired-end reads (2 × 150 bp) for VARSITY samples, achieving approximately 50 million sequencing depth per sample. VARSITY RNA-seq data underwent quality control and preprocessing, including adaptor removal, genome alignment and gene quantification, using the OmicSoft platform87. The hg38 human reference genome and gene annotations from Ensembl were used for alignment and quantification. GEMINI 1 and LTS gene expression datasets, accessible at the Gene Expression Omnibus (GEO) database under accession GSE73661, were generated through Affymetrix GeneChip Human Gene 1.0 ST arrays (Thermo Fisher Scientific)19. Sequencing data were linked to patient-level trajectory group assignments to determine trajectory-specific DEGs using DESeq2 for VARSITY samples and the limma package at the probe level for GEMINI 1 and LTS microarray data88, followed by gene set enrichment analysis (GSEA) using the Molecular Signature Database Hallmark gene sets89,90. This was done separately for both trial datasets with multiple testing correction applied using the Benjamini–Hochberg false discovery rate (FDR) method91. DEGs were reported as upregulated if they had a positive log2 fold change (FC) and FDR-adjusted P value <0.05 and vice versa for downregulated genes89,90. Genes were preranked using the sign of the log2(FC) values, thereby capturing the directionality of expression changes between groups. Gene sets were considered significantly enriched if the FDR-adjusted P value was <0.05.
Vedolizumab-specific gene modules (specifically angiogenesis, epithelial-mesenchymal transition, TNF, interferon, IL-6, JAK/STAT signaling) and their composition are provided in Extended Data Table 4. Public bulk RNA-seq datasets used to determine specificity in associations to vedolizumab included UC patients treated with infliximab and ustekinumab—(1) anti-TNF GSE73661; (2) anti-TNF GSE23597 and anti-TNF GSE12251 with patients enrolled in the ACT1 phase 3 clinical trial; (3) anti-TNF GSE16879; and (4) anti-UST GSE206285 with patients enrolled in the UNIFI phase 3 clinical trial18,20,22,92. We evaluated gene module enrichment across responders and nonresponder-treated patients. The differential gene expression results comparing nonresponders with responders (the reference group) at baseline were processed to perform a GSEA using the preranked DEGs based on the log2(FC) values.
Cohort recruitment and temporal gene-signature analysis in vedolizumab-treated and anti-TNF-treated patients with UC
In a small, densely sampled cohort of biologic-naive clinically active patients with IBD (18 receiving vedolizumab (10 with CD and 8 with UC) and 12 receiving infliximab (4 with CD and 8 with UC)) undergoing first-time ADT, we further explored the dynamics of response. In this cohort, biopsies were sampled at baseline, 2 weeks, 6 weeks and 14 weeks. In selected patients, early biopsies 24–72 h postinduction were also available. Remission was assessed clinically at 14 weeks based on Harvey–Bradshaw Index (≤4) for CD and total Mayo score (≤2, bleeding 0 and endoscopy ≤1) for UC.
Total RNA was isolated from whole biopsies according to the manufacturer’s instructions using the mirVana miRNA isolation kit (Life Technologies). Strand-specific paired-end RNA-seq libraries were prepared from total RNA using the TruSeq Stranded Total RNA kit (Illumina) and sequenced on an Illumina HiSeq 4000 platform (2 × 75 bp). Low-quality bases were filtered with the Illumina FASTQ filter, and adaptors and low-quality reads were trimmed using Trim Galore (v0.4.4), discarding sequences shorter than 35 bp. Reads were aligned to the human genome (GRCh38; v25) with STAR (v2.5.2b). Gene counts were obtained using featureCounts (v1.5.2) and normalized using the DESeq method.
Differential gene expression analysis was performed with DESeq2 (v1.40.2) using two approaches. Correction for multiple testing was performed using the Benjamini–Hochberg method, and genes with an adjusted P value <0.05 were considered significant. Functional enrichment was assessed with topGO (v2.46.0) using genes with a similar expression level as the background.
Vascular inflammation module cell-type attribution analysis
We used two publicly available scRNA-seq cohorts27,28 to investigate the clinically derived vascular inflammation module enrichment in different cell types. Here 10x-formatted count matrices and annotation information were downloaded from Zenodo (https://doi.org/10.5281/zenodo.13768607) and Single Cell Portal (SCP259). The two datasets were processed, and original annotations were added using Seurat (v5). Module scores representing vascular inflammation clinical features were calculated using the AddModuleScore function in Seurat.
Module scores were summarized at the sample level by inflammation status (inflamed, noninflamed and healthy), by disease (UC, CD and healthy controls), and/or by cell type27. Linear mixed-effects model was fitted comparing the mean module score for the target cell type versus all other cell types. The model included fixed effects for target cell-type inflammation status and condition, with a random intercept for sample to account for repeated observations from the same sample. Effect sizes were reported as estimated differences with 95% CIs. P values were adjusted across tested cell types using the Benjamini–Hochberg method. Cell types were considered enriched if they showed a positive estimated difference and Benjamini–Hochberg-adjusted P value <0.05.
CITE-seq data generation and analysis in vedolizumab nonresponders
CITE-seq was performed and processed on ileocolonic mucosal biopsies from patients with UC and CD (n = 14) at the Northwestern University NUSeq Core Facility using standard experimental processes for sample preparation and sequencing as recommended by 10x Genomics. Fresh biopsy specimens were collected in 1× Hanks′ balanced salt solution buffer (Gibco, Life Technologies). The buffer was carefully aspirated and tissue transferred to a small vial, then 500 µl of Liberase plus DNase I cocktail (MilliporeSigma) was added and the tissue was thoroughly minced using fine dissecting scissors. The tissue suspension was passed through a pipette tip ten times and incubated in a thermomixer at 37 °C at 800 rpm. The tube was centrifuged, and the resulting supernatant was passed through a 50 µl Flacon tube strainer. The tissue pellet was resuspended in another 500 µl of Liberase plus DNase I cocktail and again passed ten times through a pipette tip. The suspension was again incubated in a thermomixer at 37 °C at 800 rpm. After a second centrifugation, the supernatant was collected and passed through the 50 µl Falcon tube filter. The tissue pellet was again resuspended in Liberase plus DNase I cocktail and passed ten times through a pipette tip. A third centrifugation followed, with the supernatant again being passed through a 50 µl Falcon tube filter. The tissue pellet was resuspended in another 500 µl of Liberase plus DNase I cocktail and again passed ten times through a narrower pipette tip and then passed through the 50 µl Falcon tube filter. The cumulative post 50 µl Falcon tube filtrate containing a largely single-cell suspension was centrifuged and the supernatant was aspirated. The cell pellet was resuspended in 200 µl of cold 1× PBS as well as 2% BSA. The sample was transferred immediately to Northwestern University NUSeq Core Facility for cell counting and subsequent processing.
Cell number and viability were analyzed using Nexcelom Cellometer Auto 2000 with acridine orange and propidium iodide fluorescence staining method. A total of 16,000 cells per sample were loaded into the Chromium Controller (10x Genomics, PN-120223) on a Chromium Next GEM Chip K (10x Genomics, PN-1000127) and processed to generate single-cell gel beads in the emulsion (GEM) according to the manufacturer’s protocol. The cDNA and library were generated using the Chromium Next GEM Single Cell 5′ Reagent Kits (v2; 10x Genomics, PN-1000283) according to the manufacturer’s manual. In addition, cell surface protein and human T cell V(D)J libraries were constructed using 10 × 5′ Feature Barcode kit (10x Genomics, PN-1000256) and Chromium Single Cell Human TCR and BCR Amplification kit (10x Genomics, PN-1000252). The multiplexed libraries were pooled and sequenced on an Illumina NovaSeq X Plus sequencer with 100-cycle kits using the following read lengths: 28 bp Read 1 for cell barcode and unique molecular identifier, and 90 bp Read 2 for transcript. Raw sequencing data, in base call format (.bcl), were demultiplexed using Cell Ranger from 10x Genomics, converting the raw data into FASTQ format. Cell Ranger was also used for alignment of the FASTQ files to the human reference genome and to count the number of reads from each cell that align to each gene.
Gene expression and antibody capture data were processed using Cell Ranger (v7.2.0) with the GRCh38-2020-A reference genome and an in-house antibody reference, respectively. RNA and protein data were independently processed and clustered using the Scanpy workflow. Cell-type identities were assigned based on canonical marker gene expression and further validated by differential expression analysis of each RNA cluster. Macrophages were further subdivided based on SPP1 RNA expression—cells with detectable SPP1 expression were classified as macrophage SPP1+, whereas those lacking SPP1 expression were designated macrophage SPP1−. Comparative visualization of integrin subunit expression (β7 and α4) at the protein level was performed using the ggpubr package in R.
Peripheral blood mononuclear cell (PBMC) scRNA-seq analysis in vedolizumab-treated patients with UC
We used a publicly available cohort31 to investigate clinical features in UC PBMCs. Raw count.h5 files were downloaded from the corresponding GEO repository (GSE261334). Quality control was applied to retain high-quality cells, defined as those with ≥400 detected genes and ≤5% mitochondrial transcript content. A total of 25 PBMC samples were analyzed, including 5 from healthy controls and 5 each from post-treatment patients with UC at week 0 and week 6, stratified by responder and nonresponder status. Samples were merged, normalized and scaled; highly variable features were identified, and dimensionality reduction was performed using principal component analysis (PCA). Batch effects were corrected using Seurat’s HarmonyIntegration function with default parameters. The top principal components were used to construct a shared nearest-neighbor graph, followed by Uniform Manifold Approximation and Projection (UMAP) embedding and graph-based clustering using Seurat’s FindNeighbors and FindClusters functions (resolution = 0.2), with cluster resolution evaluated using Clustree. Cell-type identities were assigned based on canonical marker gene expression and further validated by differential expression analysis using Seurat’s FindAllMarkers function. Module scores representing clinical features were calculated using the AddModuleScore function in Seurat.
Mucosal biopsy scRNA-seq analysis in vedolizumab-treated patients with UC
We used another published cohort31 to investigate clinical features in UC rectum samples. scRNA-seq (https://figshare.com/s/3ceec45e4a640a7bceb4, https://figshare.com/s/a6142d18141697dc9650) was downloaded directly from the source provided in the original study. The scRNA-seq dataset was normalized and scaled; highly variable features were identified, and dimensionality reduction was performed using PCA. Batch effects were corrected using Seurat’s HarmonyIntegration function with default parameters. The top principal components were used to construct a shared nearest-neighbor graph, followed by UMAP embedding and graph-based clustering using Seurat’s FindNeighbors and FindClusters functions (resolution = 0.1), with resolution selection informed by Clustree analysis. The macrophage cluster was subsequently subdivided based on SPP1 expression—cells expressing SPP1 were labeled macrophage SPP1+, whereas those without detectable SPP1 expression were labeled macrophage SPP1−. Module scores representing clinical features were calculated using the AddModuleScore function in Seurat.
CosMx spatial analysis
We leveraged CosMx spatial transcriptomics data from a public UC vedolizumab dataset (CosMx cohorts 1 and 2)31 to spatially validate our findings. Seurat objects were generated from flat files downloaded from the link provided by the publication (CosMx vedolizumab cohort 1—https://doi.org/10.6084/m9.figshare.21919338; CosMx vedolizumab cohort 2—https://figshare.com/s/e8ad68ff0b4627351df0). The two CosMx datasets underwent the following workflow steps: quality control, merging, normalization and scaling; highly variable features were identified, and dimensionality reduction was performed using PCA. Batch effects were corrected using the HarmonyIntegration function with default parameters.
To achieve robust cell-type annotation in the two CosMx datasets, we used the AUCell package and a multistep approach incorporating top marker genes of general cell types by disease state from public scRNA-seq datasets using Seurat’s FindAllMarkers function, with overlapping genes from the CosMx panel and direct quantification-based gating of cell categories using the CosMx immunofluorescence protein staining.
We generated a new CosMx spatial single-cell whole-transcriptome (over 18,000 genes) dataset to further validate our spatial findings (CosMx cohort 3). Seurat objects were generated from flat files that are available for download at https://figshare.com/s/6b1fd67a7b0141dd5b32. The dataset underwent the following workflow: quality control, merging, normalization and scaling; highly variable features were identified, and dimensionality reduction was performed using PCA. Batch effects were corrected using the HarmonyIntegration function with default parameters. A shared nearest-neighbor graph was constructed using the first 30 Harmony dimensions using FindNeighbors(). Graph-based clustering was performed using FindClusters() in Seurat across a range of resolution parameters (0.1, 0.2, 0.3, and 0.5) to assess cluster granularity.
Cluster assignments at each resolution were visualized using UMAP, and a resolution of 0.2 was selected for downstream analyses based on cluster separation and biological interpretability. Cell identities were then assigned based on canonical marker gene expression. Clusters identified as low-quality or noninformative populations (clusters 11 and 18) were excluded from subsequent analyses. To further resolve macrophage heterogeneity, cells in cluster 5 were stratified according to the expression of SPP1, with positivity defined as expression >0.
Spatial cell–cell interaction analysis of the scRNA-seq, CITE-seq and CosMx vedolizumab cohorts 1, 2 and 3 was performed using CellChat (v2). For the three CosMx cohorts, individual CellChat objects were generated for each responder and nonresponder sample and subsequently merged to enable comparative analysis. Spatial coordinates of cells were scaled according to CellChat’s recommended parameters, using a conversion factor of 0.18 and a cell diameter of 1.5 µm. The standard CellChat (v2) workflow was applied to the comparison between responder and nonresponder samples.
Spatial co-occurrence probability analysis of the vedolizumab CosMx cohort 2 dataset was performed using the Squidpy package in Python (v3.13). An AnnData object was downloaded directly from the following link (https://doi.org/10.6084/m9.figshare.23896959), and cell-type annotations based on AUCell scoring with PanCK fluorescence intensity were aligned to the object. AnnData object was then subsetted to pretreatment responders (baseline) fields of view (FOVs) and the spatial co-occurrence probability of SPP1+ macrophages with other cell types was then calculated using the gr.co_occurrence and pl.co_occurrence functions from Squidpy at each FOV level.
Spatial variable gene analysis of the vedolizumab CosMx cohorts 1 and 2 was performed using the nnSVG package in R. The previously annotated Seurat objects were subsetted to include only baseline responder and nonresponder FOVs. Epithelial cells were excluded from the analysis to minimize background noise. These subsets were then converted into SpatialExperiment objects compatible with nnSVG. Spatial variability analysis was conducted using nnSVG’s default parameters without gene filtering, allowing all panel genes to be ranked for spatial variability in each FOV. To compare conditions, we calculated the mean spatial rank of each gene across FOVs. Genes with consistently higher spatial ranks in baseline vedolizumab nonresponders compared with responders (mean rank nonresponder − mean rank responder < 0) in both vedolizumab CosMx cohorts 1 and 2 were used for pathway enrichment analysis and PPI analysis using Metascape. Genes/proteins with direct PPI with SPP1 and ANGPT2 were subsetted for visualization.
Spatial colocalization between immune-cell populations and endothelial cells in CosMx cohort 3 was assessed on a per-sample basis using Squidpy. For each sample, a spatial neighborhood graph was constructed using the spatial coordinates of individual cells with 15 nearest neighbors. Cell-type neighborhood enrichment was then calculated using Squidpy’s permutation-based neighborhood enrichment test (sq.gr.nhood_enrichment) with 1,000 random permutations. This approach quantifies whether pairs of cell types occur in spatial proximity more or less frequently than expected by chance, producing a standardized enrichment z score for each cell-type pair. To summarize enrichment across samples in each clinical response group, sample-level z scores were combined using Stouffer’s weighted z method, with weights proportional to the square root of the number of cells in each sample. Positive combined z scores indicated spatial enrichment (colocalization), whereas negative z scores indicated spatial depletion.
Multi-omic CosMx data in vedolizumab-treated patients with UC
Proprietary reagents were provided by Bruker Spatial Biology, and protocols were per the Manual Slide Preparation Protocol. In summary, in situ protein expression was assessed by taking 5-µm paraffin-embedded tissue sections mounted on Apex BOND (Leica Biosystems) and quantifying expression on the CosMx spatial molecular imager platform (NanoString). Initially, formalin-fixed, paraffin-embedded tissue sections were mounted on glass slides and dried overnight at 60 °C then deparaffined with CitriSolv (Decon Labs) washed in 100% then 70% ethanol and finally 1× PBS. Sections were subject to antigen retrieval in target retrieval buffer (citate based) at 100 °C for 15 min and allowed to cool in buffer for 25 min. After PBS washes, tissue was blocked with buffer W for 1 h. Primary antibodies (64 total) and antibody markers CD298/B2M, PanCK/CD45 and CD3 were incubated on tissue for 16–18 h in buffer W. Following washes in 1× Tris-buffered saline with Tween-20 (0.00005%), fiducials were applied. After 1× PBS washes, tissue was incubated for 15 min with DSP (Pierce) solution, washed and incubated with DAPI stain, washed and treated with NHS acetate (Sulfo-NHS-Acetate, ProteoChem), before washing in 1× PBS and flow cell assembly. Flow cells were loaded onto a CosMx machine and protein run was initiated. FOV regions were selected and expression data were generated and stored in AtoMx (v2.1) for analysis.
The protein expression study was followed by RNA analysis on the same tissue slides; the flow cell cover was carefully removed with a disposable scalpel blade under 1× PBS. Tissue was then treated for 15 min with 50 mM TCEP (MilliporeSigma) and washed in 1× PBS. Tissues were incubated with Subtilisin at 40 °C for 30 min. After washing, fiducials were applied at 0.01% for 5 min, washed and incubated for 16–18 h with 1,000 plex RNA in situ hybridization probes in 0.5 nM rRNA. Tissues were washed in 50% formamide 2× saline-sodium citrate buffers, and DAPI stain was applied. After 1× PBS washes, the tissues were incubated for 1 h with antibody markers CD298/B2M, PanCK/CD45 and CD68. Tissues were washed in 1× PBS and treated with NHS acetate, washed again in 1× PBS and flow cells were assembled. Flow cells were loaded onto the same CosMx machine and placed in the same position within the machine as used for the protein run. FOV regions very closely matching the protein run were selected, and RNA expression data were generated and stored in AtoMx (v2.1) for analysis. Cells were annotated using protein expression and a cell-type marker approach, with subsequent visual confirmation of protein staining quality and examination of staining distribution patterns in AtoMx. For the RNA data paired at the single-cell level to each sample, expression of target genes was visualized using Seurat’s ImageFeaturePlot function, with the default boundary set to ‘segmentation’.
Proteomic confirmation of biomarkers and pathways in cohort 1
To assess serum protein levels of the identified tissue biomarkers, we analyzed baseline and week 14 proteomics data generated from cohort 1 patients using the Olink Explore HT NGS platform (~5,400 proteins). Tissue-derived gene signatures available in the proteomics panel were evaluated both at an individual protein level and signature-based enrichment through single-sample GSEA in nonresponder versus responder groups based on the primary clinical response. Single-sample GSEA was performed on proteins that were normalized using inverse rank transformation. Between-group differences (responders versus nonresponders) were evaluated using t tests with FDR correction at both baseline and week 14 time points. Protein/signature serum activity differences with both vedolizumab and adalimumab treatment groups are visualized in line plot format, showing mean and standard error, highlighting both baseline and week 14 values and their longitudinal changes.
Serum osteopontin (OPN; SPP1) was quantified using a microfluidic immunoassay (Ella platform, ProteinSimple) with the Human OPN 2nd Gen Simple Plex cartridge (SPCKB-PS004314; products 896055, 896098, 896959). Serum samples were stored at −80 °C, thawed at room temperature and diluted 1:100 in sample diluent before analysis. The assay uses antibody-coated glass nanoreactors to capture OPN, followed by detection with a fluorophore-labeled antibody and measurement of relative fluorescence units. Quantification was performed using lot-specific calibration curves (21–12,800 pg ml−1) fitted with a four-parameter logistic model (1/y2 weighting). Sample concentrations were calculated by interpolation from the standard curve, using the mean relative fluorescence units across triplicate nanoreactors. Quality controls included buffer and endogenous serum controls, with predefined acceptance criteria of ±20–25% accuracy and ≤20% coefficient of variation. Data were analyzed using Assist LIMS.
Multicenter cohort validation of impact for angiotensin II inhibitors
A retrospective cohort study was conducted using TriNetX, a multi-institutional de-identified federated research network and database93. The database does not include claims data or data collected from randomized clinical trials. The database contains inpatient and outpatient claims, along with prescription drug claims.
We conducted a real-time search and analysis of the US Collaborative Network in the TriNetX platform in adult patients with UC and hypertension who were initiated on vedolizumab, anti-TNF or ustekinumab therapy before 31 December 2022. Patients with UC and hypertension were identified using ‘International Classification of Diseases, Tenth Revision, Clinical Modification’ (ICD-10-CM) codes in their electronic health records for UC (K51*) and essential hypertension (I10*), respectively. Patients receiving biologics were identified using a RxNorm code (1538097). Patients were divided into two cohorts—one comprising those who started either an ACEi or ARB, and one comprising those who did not (control cohort). As a negative control, we created a second cohort of patients who started either a BB or a CCB and those who did not. Patients in the concomitant medication arms were required to have a prescription before and after initiation of the biologic to ensure ongoing use. Patients who had an ICD-10-CM code for CD were excluded to avoid misclassification bias. Patients with a history of partial or total colectomy or change in therapy within 4 weeks of initiation were excluded to account for potential insurance denials and/or inadequate trial of the therapy of interest.
The index event was the prescription of biologic, and outcome ascertainment was after 4 weeks from the index event. The outcomes included the risk of hospitalization for a UC flare, colectomy or change in therapy (treatment persistence). Patients with hospitalization for a flare were identified using RxNorm codes for methylprednisolone (6902) and hydrocortisone (5492). Patients who required total colectomy were identified using Current Procedural Terminology or ICD-10 Procedure Coding System codes. Change in therapy included a switch to an alternative advanced biologic or small-molecule therapy.
All statistical analyses were conducted using the TriNetX software using the browser-based real-time analytics feature TriNetX Live (TriNetX). One-to-one (1:1) propensity score matching was performed to balance the following covariates between groups: age, sex, race, diabetes mellitus, nicotine dependence, obesity, ischemic heart disease, heart failure, stroke, chronic kidney disease, chronic lower respiratory diseases, primary sclerosing cholangitis, other autoimmune diseases, UC medication (oral and intravenous) and steroid use before initiation of the biologic. Propensity score matching was also performed for mean hemoglobin, albumin, CRP and calprotectin. Patients with missing laboratory data were still included; however, propensity score matching adjusted laboratory covariates from patients with available data. The TriNetX platform uses input matrices of the user-identified covariates to conduct a logistic regression analysis to obtain propensity scores for all individual participants. The propensity scores generated are used to match patients using greedy nearest-neighbor algorithms with a caliper width of 0.1 pooled s.d. TriNetX randomizes the order of rows to eliminate bias resulting from nearest-neighbor algorithms. Standardized mean difference after propensity score matching indicates the success of matching a covariate between the two cohorts. A standardized mean difference of <0.1 indicates that the difference between the cohorts for the covariate is small (after matching, age, sex, race/ethnicity, comorbidities, hemoglobin, C-reactive protein, albumin and calprotectin met this threshold). After propensity score matching, the risk of each outcome was calculated and expressed as adjusted HRs with 95% CIs. Kaplan–Meier curves were generated for the ACEi/ARB cohort and control cohort after 1:1 propensity score matching.
Claims-based validation of impact for angiotensin II inhibitors
Optum’s de-identified Clinformatics Data Mart (CDM) database is built from administrative health claims collected from members enrolled in large commercial insurance plans and Medicare Advantage plans. The dataset is de-identified using the Expert Determination approach in compliance with Health Insurance Portability and Accountability Act standards and is maintained under Optum’s data use agreements. Before inclusion in Optum CDM, administrative claims submitted by physicians, hospitals and pharmacies are validated, adjudicated and stripped of identifying information. The dataset contains patient-level enrollment details and captures all medical and outpatient pharmacy claims, providing information on health care usage and costs. The covered population is geographically broad, representing individuals from all 50 states.
Patients with UC were identified using either ICD-10-CM (K51*) or ICD-9-CM (556*). Hypertension was identified using either ICD-10-CM (I10*) or ICD-9-CM (401*). Patients needed to be at least 18 years of age at the time of their first vedolizumab, anti-TNF or ustekinumab exposure. The cohort was divided into two groups—one with patients who used ACEi/ARB and one without. Patients in the ACEi/ARB group were required to have at least one refill within 3 months of biologic initiation to ensure consistent usage. Patients who had partial or total colectomy or who changed therapy within 4 weeks before initiation of biologics were excluded. Patients diagnosed with CD were also excluded. We extracted data from Optum CDM from 2000 to 2025.
The index date was defined as the prescription date of the biologic. The outcome was total colectomy identified using Current Procedural Terminology codes. The follow-up period was 1 year. Patients were censored if they died or exited insurance enrollment. The outcome was evaluated starting 4 weeks after the index date. Data were queried using SAS Studio 3.81 (Enterprise Edition). All statistical analyses were conducted using R (v4.3.1). Baseline covariates included demographics, comorbidities and IBD medication usage in the past 3 months. One-to-one propensity score matching was conducted to balance covariates between the two groups using the R package ‘MatchIt’. Covariates included age at biologic initiation, sex, race, diabetes mellitus, nicotine dependence, obesity, ischemic heart disease, heart failure, stroke, chronic kidney disease, chronic lower respiratory diseases, primary sclerosing cholangitis, other autoimmune diseases, prednisone usage, intravenous steroid usage and other biologics. We used greedy nearest-neighbor matching with a caliper of 0.1 s.d. The order of rows was randomized to avoid bias from the greedy nearest-neighbor algorithm. The risk of the outcome was represented by adjusted HRs with 95% CIs. Kaplan–Meier curves were used to visualize the two groups.
Reporting summary
Further information on research design is available in the Nature Portfolio Reporting Summary linked to this article.