
Patient characteristics
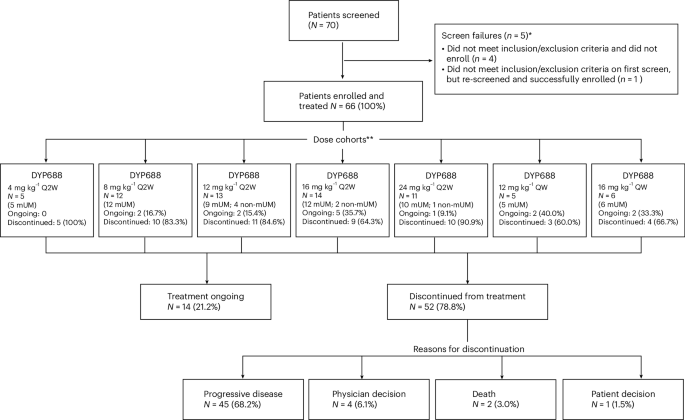
A total of 66 patients were treated with DYP688 in the dose-escalation part of this study, which began enrolling patients on 4 July 2022, with doses ranging from 4 mg kg−1 to 24 mg kg−1 every 2 weeks (Q2W; n = 55) and 12 mg kg−1 to 16 mg kg−1 once weekly (QW; n = 11). Enrollment was halted on 8 July 2025 after completion of the phase 1 portion of the study. Patient disposition is shown in Fig. 1 and Supplementary Table 1. At the data cutoff date (1 May 2025), treatment was ongoing in 14 patients (21.2%), and 52 patients (78.8%) had discontinued treatment, most (n = 45; 68.2%) due to disease progression, four (6.1%) due to physician decision, two (3.0%) due to death (due to disease progression) and one (1.5%) due to patient decision. No patients discontinued due to treatment-related adverse events (TRAEs). Deviations from the protocol were reviewed on an ongoing basis by the sponsor and the principal investigators. Protocol deviations are not uncommon in early-phase clinical trials, given their exploratory nature and the need for real-time clinical decision-making. These deviations did not impact the overall scientific validity or interpretation of the study. A summary of all protocol deviations is provided in Supplementary Table 2.
Flow diagram showing the number of patients enrolled and treated with DYP688 across various dose levels and schedules (n = 66). *One additional patient was allowed to enter treatment. **Patients were permitted to undergo intrapatient dose escalation to a higher dose deemed safe after four cycles of treatment; cohort assignment reflects the initial dose.
Demographic and baseline characteristics are summarized in Table 1. The median age was 56.5 years (range, 25−82). In total, 60 patients (90.9%) had mUM. GNAQ or GNA11 mutant melanomas arising outside the uveal tract included cutaneous primary (n = 4; 6.1%), central nervous system (n = 1; 1.5%) and unknown primary site (n = 1; 1.5%). Most patients (n = 61, 92.4%) had received prior antineoplastic therapy; most of them were heavily pretreated, with 39 patients (59.1%) having received at least two prior lines of systemic therapy. In total, 48 patients (72.7%) had received prior checkpoint inhibitors, 22 (33.3%) had received prior tebentafusp, 9 (13.6%) had received prior darovasertib and 5 (7.6%) had received prior darovasertib and crizotinib (Supplementary Table 3). Baseline American Joint Committee on Cancer (AJCC) metastatic categories for patients with uveal melanoma by dose cohort are summarized in Extended Data Table 1. Overall, four patients (6.1%) were reported to have responded to any prior therapy. Most patients (n = 30, 40.5%) had progressive disease as the best overall response (BOR) to their last prior therapy, and, in these patients, the median time from last treatment to progression had been 2.76 months (range, 0.0−19.3). At study entry, most patients had liver metastases (n = 57, 86.4%); 43 patients (65.2%) had lactate dehydrogenase (LDH) levels above the upper limit of normal (ULN); and 16 patients (24.2%) had LDH levels >2× ULN.
Safety
Of the 66 patients evaluable for safety and maximum tolerated dose (MTD)/recommended dose determination, only one experienced a dose-limiting toxicity (DLT). This patient received DYP688 at 24 mg kg−1 Q2W and experienced grade 3 hypotension 2 days after the first infusion. The patient was treated with supportive care, and the event resolved within 24 h. The DYP688 dose was reduced to 16 mg kg−1 Q2W for subsequent infusions without further hypotensive episodes.
Sixty-five patients (98.5%) experienced at least one treatment-emergent adverse event (TEAE). The TEAEs are summarized in Table 2.
The most frequently reported TEAEs (occurring in ≥20% of patients) were fatigue (n = 30, 45.5%); asymptomatic hypercalcemia (n = 24, 36.4%); dry mouth and peripheral edema (n = 20 each, 30.3%); constipation (n = 17, 25.8%); abdominal pain, anemia and nausea (n = 16 each, 24.2%); and dyspnea (n = 14, 21.1%).
TRAEs of any grade were reported in 60 patients (90.9%). All TRAEs were of grade 2 or lower severity, except for five grade 3 events: hypotension, asymptomatic hypercalcemia, anemia, increased gamma-glutamyl transferase (GGT) and decreased lymphocyte count. The most common TRAEs (all grades, all doses) were hypercalcemia (n = 19, 28.8%); dry mouth and fatigue (n = 15 each, 22.7%); peripheral edema (n = 12, 18.2%); anemia (n = 10, 15.2%); increased aspartate aminotransferase and constipation (n = 8 each, 12.1%); increased alanine aminotransferase, epistaxis and nasal congestion (n = 7 each, 10.6%); and asthenia, hypophosphatemia, nausea and thrombocytopenia (n = 6 each, 9.1%). Dermatological TRAEs were infrequent and nonserious, with all events reported as grade 2 or lower. Vitiligo was observed in three patients (4.5%), all grade 1. TRAEs of any grade reported in at least 5% of patients in treatment groups 12, 16 and 24 mg kg−1 Q2W, in at least 5% of patients in treatment groups 12 and 16 mg kg−1 QW and in all patients are shown in Supplementary Fig. 1.
Treatment-emergent serious adverse events (SAEs) were reported in 26 patients (39.4%). Of these, grade 3 or higher events were reported in 21 patients (31.8%). Treatment-related SAEs were reported in four patients (6.1%). Bradycardia (grade 1), sinus tachycardia (grade 2), infusion-related reaction (grade 2) and hypotension (grade 3, DLT) were reported in one patient each (1.5%). No treatment-related SAEs higher than grade 3 were reported in the study.
No patients discontinued the study treatment owing to adverse events. TRAEs that led to dose reduction were reported in three patients (grade 3 hypotension, grade 2 anemia and grade 1 hypercalcemia), and TRAEs that led to interruption of study drug were reported in eight patients (12.1%) (Table 2).
Pharmacokinetics
Pharmacokinetics data were available for 66 patients, who received DYP688 at doses of 4, 8, 12, 16 or 24 mg kg−1 intravenous infusion Q2W or 12 or 16 mg kg−1 intravenous infusion QW. A dose-dependent increase in pharmacokinetics exposure (area under the concentration–time curve (AUC)) was observed across total antibody, conjugated active payload, conjugated inactive phosphorylated payload and free payload. Exposure to free payload in blood was markedly lower compared to conjugated active payload in plasma, with approximately 80-fold lower AUC0−336 h at DYP688 24 mg kg−1 intravenous infusion Q2W at steady state.
The geometric mean effective half-life of the total antibody (serum) and free payload (blood) was 8.6 days and 12 days, respectively. The geometric mean apparent terminal half-life of the conjugated active payload (plasma) was approximately 2 days. Mean concentration−time profiles of the total antibody, active conjugated payload and free payload are shown in Fig. 2a,b.
a, Mean (s.d.) serum concentration−time profiles of DYP688 total antibody on C3D1 (n = 66). b, Mean (s.d.) concentration–time profiles of DYP688-conjugated active payload (plasma) and free payload (blood) on C3D1 (n = 66). c, Best percentage change in tumor diameters by active conjugated payload concentration. d, Best percentage change in ctDNA by active conjugated payload concentration. e, Best percentage change in LDH levels by active conjugated payload concentration. c–e, P values are from two-sided correlation tests.
An apparent relationship was observed between average concentration (Cavg) of the active conjugated payload and tumor size change, with increased tumor shrinkage seen with higher exposure in patients (Fig. 2c). A similar trend was observed between exposure (Cavg of the active conjugated payload) and circulating tumor DNA (ctDNA) reduction with absence of detectable ctDNA in several patients, on-treatment with higher exposure (Fig. 2d). Higher exposure was also associated with greater reduction in blood LDH levels in patients (Fig. 2e), although the trend is relatively weak. The Cavg was calculated using a population pharmacokinetics model for the active conjugated payload and simulating the pharmacokinetics profiles up to the time at which the best change in tumor, ctDNA or LDH was observed. The model-based calculation of exposure accounts for changes in the patientʼs dosing history—for example, dose interruptions and intrapatient dose escalation.
Immunogenicity was assessed using a three-tiered approach comprising screening, confirmatory and titer assays. Based on available data as of the data cutoff date, DYP688 demonstrates low immunogenicity, with an ADA incidence of less than 10%.
Efficacy
Of the 66 patients treated, 65 had measurable disease at baseline (Extended Data Table 2). The median duration of treatment was 7.2 months (range, 1.8−26.6). Confirmed objective responses were seen in 13 out of 66 patients (19.7%), with 2 out of 12 (16.7%) at 8 mg kg−1 Q2W, 3 out of 13 (23.1%) at 12 mg kg−1 Q2W, 5 out of 14 (35.7%) at 16 mg kg−1 Q2W, 2 out of 5 (40.0%) at 12 mg kg−1 QW and 1 out of 6 (16.7%) at 16 mg kg−1 QW, with evidence of deepening response over time in some patients. One patient with cutaneous melanoma with non-measurable disease per Response Evaluation Criteria in Solid Tumors (RECIST) version 1.1 at baseline (enrolled outside protocol-specified criteria) achieved a confirmed complete response at 12 mg kg−1 Q2W. Three patients achieved a partial response after intrapatient dose escalation: two patients who were escalated from 8 mg kg−1 Q2W to 24 mg kg−1 Q2W and another who was escalated from 12 mg kg−1 Q2W to 24 mg kg−1 Q2W. Progressive disease was seen in 11 out of 66 patients (16.7%), and stable disease was seen in 41 out of 66 patients (62.1%). Efficacy outcomes for patients with uveal melanoma are summarized in Supplementary Table 4. Median (95% confidence interval (CI)) duration of response by Kaplan−Meier analysis was 10.5 months (3.7−not evaluable); disease control rate (DCR) for the 66 patients was 81.8% (95% CI: 70.4−90.2). Best percentage change from baseline in sum of longest target lesion diameters based on local radiology review is shown in Fig. 3a. Tumor size reduction was observed in 47 out of 66 patients (71.2%). An analysis of the best percentage change in target lesion size by anatomical location showed tumor shrinkage across liver, lung, lymph node and other sites, with no evidence of preferential response by organ site (Supplementary Fig. 2). Fourteen patients (21.2%) remained on-treatment for at least 12 months (Fig. 3b).
a, Percentage change from baseline in sum of the longest diameters by radiology review. The percentage of tumor size reduction is illustrated on the y axis. Every bar is one patient. The horizontal line represents at least a 30% decrease in the sum of the diameters of target lesions in patients. One patient was non-evaluable at the only post-baseline scan as one of the target lesions could not be measured, and one patient had non-measurable disease at baseline. b, Duration of treatment. The x axis denotes time in months; each horizontal bar on the y axis represents a single patient. B, darovasertib and tebentafusp prior treatment; B*, darovasertib plus crizotinib and tebentafusp prior treatment; D, darovasertib prior treatment; D*, darovasertib plus crizotinib prior treatment; N, no prior darovasertib/crizotinib or tebentafusp treatment; PD, progressive disease; PR, partial response; pts, patients; SD, stable disease; T, tebentafusp prior treatment.
In total, 14 patients were censored, and 52 patients (78.8%) had progression-free survival (PFS) events. Of the patients with PFS events, 49 (74.2%) had disease progression and 3 (4.5%) died. The estimated median PFS (95% CI) was 7.2 (5.3−7.8) months.
Patients with high baseline tumor burden, high LDH and high ctDNA fraction were less likely to respond/show tumor regression to treatment (Extended Data Fig. 2a–c). Treatment with DYP688 appeared to induce a reduction in ctDNA fraction at cycle 3, day 1 (C3D1) among patients who achieved a partial response, compared to those with stable disease or progressive disease (Extended Data Fig. 3). The baseline ctDNA levels were noted as a prognostic marker of PFS. Patients with a lower baseline ctDNA have a significantly longer PFS compared to patients with higher baseline ctDNA (P = 0.00084; Extended Data Fig. 4). Although an overall positive exposure–response relationship was observed, a diminished response was unexpectedly noted at the 24 mg kg−1 Q2W dose level (Extended Data Fig. 5). Additionally, exploratory analyses suggest differences in the distribution of best percentage change in tumor diameters across BAP1 and SF3B1 mutation groups, with attenuated reductions observed in tumors harboring BAP1 mutations, particularly in rare combination with SF3B1 mutations (Extended Data Fig. 6). GNAQ/GNA11 mutation status, as detected in cell-free DNA (cfDNA), remained largely stable throughout treatment (Extended Data Fig. 7), and tumor mutational burden, as assessed by TruSight Oncology 500 (TSO500), was not correlated with best percentage change in tumor size (Extended Data Fig. 8).
Biomarker analysis
Proteomic profiling on plasma samples collected from 38 patients was performed using the SomaScan assay27,28. Circulating unbound plasma PMEL showed a dose-dependent reduction after DYP688 administration, consistent with target binding (Fig. 4a). At lower DYP688 doses, a rebound in unbound PMEL was observed at cycle 1, day 15 (C1D15) (Fig. 4b), indicating that there is insufficient DYP688 to bind and engage the newly synthesized and/or shed PMEL.
a,b, Scatter plots (a) and box plots (b) showing the relationship between the change in circulating PMEL levels and drug exposure measured as an instantaneous concentration of total monoclonal antibody (mAb; a) and dose group (b). Pearsonʼs correlation coefficient and its two-sided test P value are indicated. Gray area denotes 95% CI. n = 33 (C1D2) and n = 34 (C1D15) biological replicates. c, PMEL H-scores on paired tumor biopsies at baseline and C1D16−C1D18 indicated no consistent change in PMEL expression in tumors after DYP688 exposure. Patients who progressed on prior tebentafusp treatment (red dots) did not differ in their PMEL expression at baseline compared to those who were naive to PMEL-targeted therapy (n = 57 at screening and n = 42 on-treatment). d, Scatter plot showing the percentage of PMEL-positive tumor cells at screening for individual patients. Each symbol represents one patient and is annotated by prior tebentafusp (tebe) regimen (shape) and BOR (color). e−g, Baseline PMEL concentrations in plasma (log2-transformed normalized relative fluorescence unit values (log2RFU)) plotted against the sum of the target lesion diameters (e, shortest and longest diameters for nodal and non-nodal lesions, respectively), best percentage change in tumor size measured by sum of target lesions (f) and categorized by treatment response (g). Pearsonʼs correlation coefficient and its two-sided test P value are indicated (e,f). Gray area denotes 95% CI. n = 37 biological replicates (e,f). n = 7 (PD C1D1), 24 (SD C1D1), 6 (PR C1D1), 7 (PD C1D2), 24 (SD C1D2), 4 (PR C1D2), 6 (PD C1D15), 24 (SD C1D15), 6 (PR C1D15), 3 (PD C3D1), 23 (SD C3D1) and 6 (PR C3D1) biological replicates (g). h−l, Box plots depicting gene set variation analysis (GSVA)-derived gene set scores for key molecular pathways, including MAPK pathway activity score (MPAS)48 (h) as well as hallmark MYC targets V1 (i), MYC targets V2 (j), G2M checkpoint (k) and E2F targets (l). n = 17 (screening) and n = 18 (C1D16−C1D18, 15 pairs) biological replicates. m,n, Box plots show GSVA scores for G2M checkpoint (m) and E2F targets (n) pathways at baseline (screening) and after treatment initiation (C1D16−C1D18). Non-responders (tumor growth; denoted in red) exhibited a higher baseline expression of proliferation-related pathways than responders (tumor shrinkage; denoted in blue). n = 6 (tumor_growth, screening), 11 (tumor_shrinkage, screening), 5 (tumor_growth, C1D16−C1D18) and 13 (tumor_shrinkage, C1D16−C1D18) biological replicates. All box plots show median (line), first and third quantiles (25th and 75th percentiles; hinges) as well as whiskers to the highest/lowest values no farther than ±1.5× the interquartile range from the hinge (all points are shown, and outliers are not duplicated). NE, not evaluable.
Core needle biopsies were collected from tumor tissue at baseline and at cycle 1 between days 16 and 18 (C1D16−C1D18). PMEL expression in biopsies was analyzed by immunohistochemistry (IHC). Levels of PMEL in situ at baseline (n = 56 evaluable) were measured by IHC varied across the patient population. Furthermore, prior treatment with PMEL-targeted tebentafusp did not seem to affect this variability in expression. When comparing PMEL H-scores at baseline with those from the C1D16−C1D18 timepoint (n = 41 evaluable pairs), no clear directionality of change was observed, indicating that treatment with DYP688 did not uniformly affect the PMEL status of the sampled tumors at C1D16−C1D18 (Fig. 4c), supporting the hypothesis that changes in circulating PMEL likely stem from engagement of the protein by DYP688 rather than changes in expression of PMEL by the tumor. In addition to the IHC H-score analysis, the percentage of PMEL-positive cells at baseline is shown in Fig. 4d. This information is presented alongside BOR and prior tebentafusp therapy for each patient, enabling a more granular evaluation of the relationship between baseline PMEL expression and clinical outcome. Most patients exhibited high levels of PMEL expression at screening. Clinical responses appeared independent of baseline PMEL expression, and no clear differences in PMEL expression were observed according to prior treatment history.
Of note, baseline PMEL concentrations in circulation were positively associated with tumor burden (sum of target lesion diameters) and treatment response (Fig. 4e–g), supporting its potential as a pharmacodynamic marker and a potential additional biomarker for tumor burden and clinical outcome29.
In line with the mechanism of action of DYP688, RNA-sequencing data from liver metastasis biopsy samples showed a significant downregulation in gene signature scores for mitogen-activated protein kinase (MAPK) pathway activity and pathways associated with cell cycle and proliferation after treatment compared to baseline samples (Fig. 4h–l). Stratification of patients based on treatment response revealed notable differences in transcriptomic profiles from baseline and after start of treatment. Non-responders exhibited higher baseline expression of proliferation-related pathways, suggesting that intrinsic pathway activation may limit therapeutic efficacy. By contrast, responders demonstrated a marked downregulation of glycolysis-related pathways after treatment, a pattern not observed in non-responders (Fig. 4m,n). These findings suggest distinct molecular mechanisms underlying therapeutic response, with potential implications for patient stratification and the development of personalized therapeutic strategies.



