
Ethics statement
The trial was conducted in accordance with the Good Clinical Practice guidelines of the International Council for Harmonization and the principles of the Declaration of Helsinki. The protocol and amendments were approved by the institutional review board at each participating site and regulatory authorities of participating countries. The institutional review boards that approved this study were Advarra, Dana-Farber Cancer Institute, WCG, Salus, John Hopkins Medicine, Memorial Sloan Kettering, Mary Crowley Medical Research Center, UCLA Office of Human Research Protection Program, NYU Grossman School of Medicine and Columbia University Irving Medical Center.
All patients provided written informed consent. The trial was designed by Revolution Medicines (study sponsor). The data were collected by investigators and analyzed by statisticians employed by Revolution Medicines.
All animal studies were conducted in accordance with protocols approved by the Institutional Animal Care and Use Committee at each study site and were performed in compliance with all applicable institutional and national guidelines for the care and use of laboratory animals.
Statistics and reproducibility
The clinical study NCT05379985 was conducted as a single-arm phase 1/2 trial; therefore, participants were not randomized. Investigators were not blinded to allocation during experiments and outcome assessment unless otherwise indicated.
For preclinical studies, power analyses were used to drive sample size determination as appropriate. Randomization was used in preclinical in vivo studies. Sample sizes for preclinical experiments were determined based on study objectives, previous experience with similar models and practical considerations and were not predetermined using formal statistical methods. Unless otherwise specified, no data were excluded from the analyses.
Circulating tumor DNA assessment in patients with acquired resistance
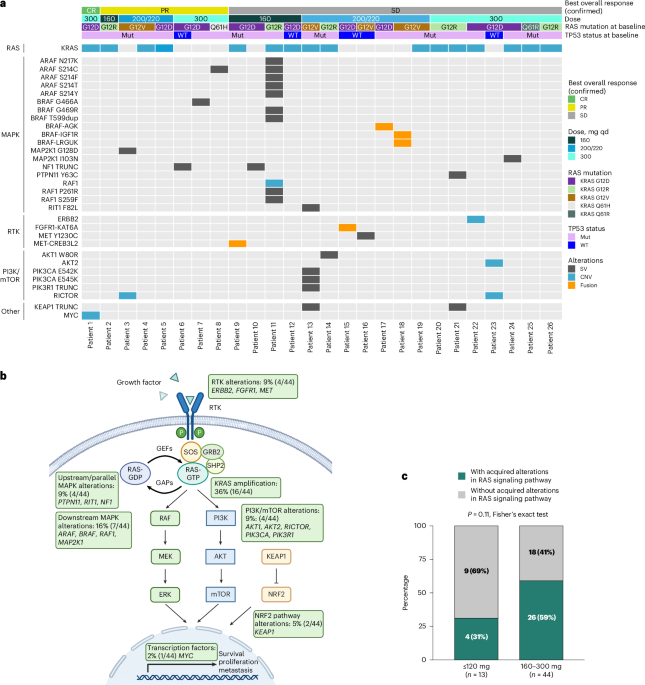
Patients with RAS mutant metastatic PDAC treated at 160 mg to 300 mg daraxonrasib as second-line or later therapy and disease progression were assessed for acquired resistance. Acquired resistance was defined as patients with a PFS of more than 3 months (including SD or PR or CR) and subsequent progression, in line with previous criteria applied for patients with acquired resistance19. Paired pretreatment and EOT at time of progression ctDNA assessment using the Guardant Health Infinity next-generation sequencing panel with 800+ genes was performed in 44 patients meeting these criteria. Tissue sequencing was also performed in one patient with a paired pretreatment and EOT tissue biopsy.
An acquired alteration in EOT ctDNA was defined as a known or likely oncogenic mutation annotated by OncoKB and not detected in pretreatment ctDNA. To account for false-negative acquired variants due to low shedding in pretreatment ctDNA, pretreatment samples were required to have at least one somatic variant detected to be considered for paired analysis. Acquired oncogenic variants were examined in RAS, MAPK, RTK, PI3K/AKT and MYC pathways based on definitions by Vega et al.43. CN alterations were defined as any CN <2 copies for gene deletions and >2 copies for gene amplifications; patients without reported CN alterations in a gene thus had two copies (normal diploid state) detected in total cell-free DNA. Supplementary Table 4 lists all known or likely oncogenic alterations detected in pretreatment ctDNA.
Animal studies using xenograft and syngeneic tumor models
Studies were conducted at Revolution Medicines, Washington University School of Medicine and at contract research organizations, including Pharmaron and WuXi AppTec. No statistical methods were used to predetermine sample sizes but our sample sizes are similar to those reported in previous publications33. All CDX/PDX mouse studies and procedures related to animal handling, care, and treatment complied with all applicable regulations and guidelines of the Institutional Animal Care and Use Committee at each facility with approvals. The maximum tumor burden permitted was 2,000–2,300 mm3. Tumor growth was monitored regularly, and animals were killed according to the study protocol. In a small number of cases, due to rapid tumor growth between scheduled measurements, tumor volumes somewhat exceeded 2,000–2,300 mm3 just before killing.
For studies with PSN-1 and Capan-1 CDX tumors, female BALB/c nude mice 6–8 weeks old were used. The animals were purchased from ZheJiang Vital River Laboratory Animal Technology Co. and Shanghai Sino-British SIPPR/BK Laboratory Animal Co. For studies with HPAC CDX tumors, female athymic nude mice aged 6 weeks were used. For study with HPAF-II CDX tumors, female SCID Beige mice 6–8 weeks old from Beijing Vital River Laboratory Animal Technology Co. were used. For study with KP-4 CDX tumors, female BALB/c nude mice 6–8 weeks old purchased from Shanghai Sino-British SIPPR/BK Lab Animal Co. were used. For studies with KPC/Y GEMM-derived models, female C57BL/6J mice 6–8 weeks old were used obtained from The Jackson Laboratory. For study with MIA Paca-2 CDX tumors, 8–12-week-old female NSG mice were purchased from The Jackson Laboratory.
In vivo model development
Capan-1 tumor cells (ATCC-HTB-79) were maintained in vitro as a monolayer culture in IMDM supplemented with 20% heat-inactivated fetal bovine serum, at 37 °C in an atmosphere of 5% CO2 in air and routinely subcultured twice weekly by trypsin–EDTA treatment. Cells in the exponential growth phase were collected and counted for tumor inoculation. Each mouse was inoculated subcutaneously on the right flank with 5 × 10⁶ Capan-1 tumor cells in a 0.2-ml PBS/Matrigel mixture (1:1 ratio) to initiate tumor development. For efficacy studies, treatments were initiated when the average tumor volume reached 146 mm3 (Fig. 3e) or 167 mm3 (Fig. 4c) Animals were assigned to groups using Studylog-based randomization software which performed stratified randomization based on tumor volumes. For the pharmacodynamic (PD) study, treatments were initiated when the average tumor volume reached 400–600 mm3.
The HPAF-II tumor cells (ATCC, CRL-1997) were maintained in vitro as a monolayer culture in EMEM supplemented with 10% fetal bovine serum and 1% antibiotic–antimycotic at 37 °C in an atmosphere of 5% CO2 in air and routinely subcultured twice weekly. Cells growing in an exponential growth phase were collected, counted for tumor inoculation, and inoculated subcutaneously at the right upper flank with 3 × 10⁶ tumor cells in 0.2 ml of PBS with Matrigel (1:1) per animal. Treatments were initiated at the time of randomization when the mean tumor volume reached 155 mm3.
The Capan-1 tumor model resistant to daraxonrasib (25 mg kg−1 po qd) was established through serial passaging with daraxonrasib treatment in vivo (Extended Data Fig. 3). For each round of tumor passaging, recipient mice were dosed with daraxonrasib at 25 mg kg−1 for 3 days before the implantation of tumor fragments, followed by continued daily dosing of daraxonrasib until tumor volumes >600 mm3 at which time these were collected and re-passaged. Daraxonrasib-resistant tumors from passage 3 (P3) and passage 5 (P5) were used for PD and efficacy studies, respectively. Each mouse was inoculated subcutaneously in the right upper flank with daraxonrasib-resistant Capan-1 tumor slices (~30 mm3) to initiate tumor development. For the PD study, treatments were initiated when the average tumor volume reached 400–600 mm3. For the efficacy study, treatments were initiated when the average tumor volume reached 163–164 mm3. The animals were assigned to groups (n = 6) using a Studylog-based randomization software as above. Similarly, the HPAF-II tumor model resistant to RMC-7977 (10 mg kg−1 po qd) was established through serial passaged with RMC-7977 treatment in vivo (Extended Data Fig. 3).
HPAC tumor cells (ATCC CRL-2119) were maintained as a monolayer culture in RPMI 1640 medium supplemented with 10% fetal bovine serum and 1% penicillin–streptomycin at 37 °C in a humidified atmosphere containing 5% CO2. The culture medium was refreshed every 2–3 days, and cells were routinely subcultured at 80–90% confluence using trypsin–EDTA, with passages limited to a maximum of 4–5. Cells in the exponential growth phase were collected, counted for tumor inoculation and each mouse was inoculated subcutaneously in the right flank with 1 × 10⁷ cells suspended in 100 µl of a 1:1 mixture of RPMI 1640 and Matrigel to establish tumors. Treatment commenced upon randomization once the mean tumor volume reached 139 mm3. For in vivo RAS(ON) inhibitor-resistant model derivation, HPAC xenograft tumors that emerged after initial tumor regressions in response to RMC-9945 (the RAS(ON) G12D-selective inhibitor tool representative of the investigational agent zoldonrasib26), wherein we observed amplification of mutant KRASG12D in vivo (Fig. 3d and Extended Data Fig. 5b). We then established a HPAC tumor-derived cell line from these RMC-9945-resistant tumors, which was maintained under constant RAS(ON) inhibitor pressure.
KPC/Y GEMM-derived tumor cells 6694c2, 2838c3, 6499c4 and 6419c5, were obtained from Kerafast and are referred to as KPCYc2, KPCYC3, KPCYc4 and KPCYc5 thereafter. Cells were maintained as a monolayer culture in DMEM supplemented with 10% fetal bovine serum and 1% penicillin–streptomycin at 37 °C in a humidified atmosphere containing 5% CO2. The culture medium was refreshed every 2–3 days, and cells were routinely subcultured at 80% confluence using trypsin–EDTA, with passages limited to a maximum of 3–4. Cells in the exponential growth phase were collected, counted for tumor inoculation and each mouse was inoculated subcutaneously in the right flank with 3 × 10⁵ cells resuspended in serum-free DMEM. For efficacy studies, treatment commenced upon randomization once the mean tumor volume reached 100–120 mm3.
For studies performed in MIA Paca-2 (ATCC CRL-1420) CDX tumors, WU-0002, WU-0022 PDX tumors, 2–5 million PDAC cells or 5 x 5 x 5-mm chunks of cryopreserved PDXs were mixed 1:1 (v/v) with Matrigel matrix (Corning) and inoculated into both flanks of 8–12-week-old female NSG mice (purchased from The Jackson Laboratory) by needle injection or small incision subcutaneously at the flanks of each mouse. Treatments were initiated when the tumors reached ~100 mm3 in volume.
KP-4 tumor cells (RIKEN-RCB1005) were maintained in vitro as a monolayer culture in IMDM supplemented with 20% heat-inactivated fetal bovine serum at 37 °C in an atmosphere of 5% CO2 in air and routinely subcultured twice weekly by trypsin–EDTA treatment. The cells growing in an exponential growth phase were collected, counted for tumor inoculation and each mouse will be inoculated subcutaneously at the right upper flank with KP-4 tumor cells (5 × 10⁶) in 0.2 ml of PBS with Matrigel (1:1) for tumor development. Treatments were initiated at the time of randomization when the mean tumor volume reached 141 mm3 (Fig. 4e) or 160 mm3 (Fig. 4f).
The PSN-1 tumor cells (ATCC CRL-3211) were cultured as a monolayer culture in RPMI 1640 medium supplemented with 10% fetal bovine serum at 37 °C in an atmosphere of 5% CO2 in air. The medium was renewed every 2–3 days and tumor cells were routinely subcultured at a confluence of 80–90% by trypsin–EDTA, not exceeding 4–5 passages. Cells in the exponential growth phase were collected, counted for tumor inoculation and each mouse was inoculated subcutaneously on the right flank with 5 × 10⁶ PSN-1 tumor cells in 100 µl of an RPMI 1640/Matrigel mixture (1:1 ratio) to initiate tumor development. Treatments were initiated at the time of randomization when the mean tumor volume reached 171 mm3.
In vivo treatment
For tumor growth evaluation studies, tumor-bearing animals were randomized and grouped for treatments (n = 4–10 per group). The vehicle, daraxonrasib, zoldonrasib, RMC-7977, RMC-9945, azenosertib or IAG933 at indicated doses were administered daily or at indicated dosing schedule via oral gavage with a 10 ml kg−1 dosing volume. Daraxonrasib (25 mg kg−1 po qd) combined with zoldonrasib (100 mg kg−1 po qd) was well tolerated in syngeneic models using immunocompetent C57BL/6J mice; however, this same dosing regimen was not tolerated in xenograft models in immunodeficient mice and a reduced daraxonrasib dose (10 mg kg−1 po qd) was used in combination with zoldonrasib (100 mg kg−1 po qd) to ensure tolerability. T-DXd was purchased from Gruechem and dosed at 4 mg kg−1 via i.v. injection weekly for studies performed in Capan-1 and daraxonrasib-resistant Capan-1 tumors. DS-8201a used in studies of MIA Paca-2, WU-0002, WU-0022 and Pa01C tumors was purchased from the Washington University Siteman Cancer Center Pharmacy and approved for use under Institutional Biosafety Committee protocol 16701 v.3 and dosed at 10 mg kg−1 via i.v. injection weekly. Azenosertib and IAG933 were purchased from Gruechem. Animals were euthanized as previously described8. Snap-frozen and formalin-fixed samples were collected following the same protocols as previously described28,44. RMC-9945, zoldonrasib, daraxonrasib, azenosertib, IAG933 and the combination of daraxonrasib plus azenosertib or IAG933 were formulated in 10:20:10:60 (%v/v/v/v) (DMSO:PEG400:Solutol HS15:water). T-DXd was formulated in sterile saline. For studies performed in MIA Paca-2, WU-0002, WU-0022 and Pa01C tumors, daraxonrasib was formulated in vehicle consisting of 5% DMSO (CAS no. 67-68-5; Fisher Scientific).
In vivo study data analysis
In tumor volume plots, the average tumor volume of each group in CDX models was plotted post-implantation, while the x axis started on the first day of treatment in daraxonrasib-resistant Capan-1, KPC, WU-0002, WU-0022, Pa01C and MIA Paca-2 tumor models. Control and treatment groups were compared by two-way repeated-measures ANOVA (Dunnett’s multiple comparisons test) on the last measurement day of the control group. Tumor diameter was measured in two dimensions using a digital caliper and mice in the study were weighed twice per week. The tumor volume in mm3 was calculated based on the formula: volume = (length × (width)2)/2. An individual tumor was deemed to have regressed (R) if it showed >10% reduction in tumor volume from the initial volume and deemed to have CR if it showed ≥80% reduction in tumor volume from the initial volume on a given day. The percentage change in body weight for each animal on a given day was determined as ((body weight on test article administration end date/body weight on test article administration start date) − 1) × 100.
In vitro resistant cell line establishment and characterization
HPAC CDX tumors relapsed on RMC-9945 (RAS(ON) G12D-selective inhibitor) were collected and dissociated using the Tumor Dissociation kit (human, cat. no. 130-095-929) in conjunction with a gentleMACS Octo Dissociator to isolate tumor cells. These isolated tumor cells were cultured in vitro under inhibitor pressure until they demonstrated sustained growth in the presence of 100 nM RMC-9945 (Extended Data Fig. 3 provides a schematic illustration). The resistant cells were characterized to confirm cell identity, purity, and KRAS G12D/WT CN via digital PCR, along with whole-exome sequencing with ~100× coverage at Azenta.
Droplet digital PCR and digital PCR
Genomic DNA (gDNA) was extracted from at least 20 mg of tumor tissue using a QIAamp DNA Mini kit (QIAGEN, cat. no. 51304). Then, 20 ng of gDNA was included for digital PCR (dPCR) using the Naica system multiplex digital PCR (Stilla) or Thermo Fisher QuantStudio Absolute Q Digital PCR system following the manufacturer’s protocol. Probes and primers for the following genes were included in the multiplexed droplet dPCR of PSN-1 end-of-study tumors: KRASWT (dPCR Mutation Detection Assay KRAS WT for p.G12C, Human (Apexbio, AA100902-WT)), KRASG12R (dPCR Mutation Detection Assay KRAS Mutant for p.G12R, Human (Apexbio, AA100904-MU)) and RPP30 (RPP30 probe, 5′-Cy5-TTCTGACCTGAAGGCTCTGCGC-3′; RPP30 primer F, 5′-TCAGCATGGCGGTGTTT-3′; RPP30 primer R, 5′-TGGCATGAGGTTGGCCA-3′); MYC (MYC probe FAM-TGCTGCTGCTGCTGGTAGAAGTTC; MYC primer F, 5′-GGTGCAGCCGTATTTCTACTG -3′; MYC primer R, 5′-AGCAGCTCGAATTTCTTCCAGA-3′). The results were normalized to RPP30 for CN assessment.
For the dPCR analysis of HPAC resistant cells, DNA was extracted from ~2 million cells using the DNeasy Blood & Tissue kit (QIAGEN, cat. no. 69504). Then, 9 ng of gDNA was included for dPCR using the Thermo Fisher QuantStudio Absolute Q Digital PCR system following the manufacturer’s protocol. The following kits were used for KRAS WT, KRAS G12D and MYC detection and CN evaluation: Absolute Q Liquid Biopsy dPCR Assays, (Thermo Fisher Scientific, A53732, assay ID DGPRJZK), RNaseP (Thermo Fisher Scientific, 4485714) and MYC (Thermo Fisher Scientific, assay ID Hs00292858_cn). The results were normalized to RNaseP for CN assessment.
Immunohistochemistry
Tumor fragments collected from mice after the indicated treatments were fixed in 10% neutral buffered formalin at room temperature for up to 24 h, stored at 70% ethanol and then processed into paraffin blocks. All staining was performed on 4-µm tissue sections.
For IHC staining of HER2 in tumor tissues collected from Capan-1 and daraxonrasib-resistant Capan-1 model, formalin-fixed paraffin-embedded (FFPE) sections were stained on a BOND-III Automated IHC Stainer using the manufacturer’s recommended settings. Anti-EpCAM rabbit monoclonal antibody (Cell Signaling Technology, cat. no. 14452, clone: D9S3P) was used at 1:400 dilution with EDTA-based pH 9 epitope retrieval solution. Anti-HER2 rabbit monoclonal antibody (Gene Tech, cat. no. GT224507) was used with EDTA-based pH 9 epitope retrieval solution. A BOND IHC Polymer detection kit (Leica, DS9800) was used to detect rabbit primary antibodies. DAB-stained slides were scanned and digitized with a 3DHISTECH Panoramic MIDI whole-slide scanner at ×200 magnification.
To stain tissues from KPCY allograft models, a Biocare IntelliPATH automation system was used. Anti-phospho-ERK1/2 rabbit monoclonal antibody (Cell Signaling Technology cat. no. 4370, clone D13.14.4E) was used at 1:200 dilution and anti-panCK rabbit monoclonal antibody (Abcam, cat. no. ab308262, clone EPR28285-45) was used at 1:5,000 dilution with citrate-based pH 6.2 Heat-Induced Epitope Retrieval (Biocare, cat. no. DV2004). Primary antibodies were detected with the MACH4-HRP-polymer Detection System (Biocare, MRH534). Stained slides were scanned and digitized with a TissueScope LE (Huron Digital Pathology) whole-slide scanner at ×20 magnification. Image analysis was performed using HALO software from Indica Labs.
For IHC staining of RAS in HPAC control tumors and tumors relapsed on RMC-9945 treatment, FFPE sections were stained on the Biocare IntelliPATH automated staining platform using the manufacturer’s recommended settings. Anti-human Ras rabbit monoclonal antibody (Cell Signaling, cat. no. 67648, clone E8N8L, lot no. 2, 44 μg ml−1) was used at 1:400 dilution (0.11 μg ml−1) with citrate-based pH 6.2 Heat-Induced Epitope Retrieval (Biocare, cat. no. DV2004); an isotype control (rabbit IgG) was used under the same conditions. Stained slides were digitized with a Leica ScanScope AT whole-slide scanner at ×200 magnification.
Whole-slide image analysis
panCK staining was used to identify epithelial cells. First, the area to be analyzed was delineated, excluding necrotic regions. The random forest Tissue Classifier from the HALO Image Analysis package was used to identify the tumor compartment. Three classes were created: glass, tumor (panCK-positive) and stroma. The tumor class mark was then copied onto the serial sections stained with markers to perform the image analysis on only the tumor compartment.
Quantification of pERK was performed with the HALO Image Analysis software from Indica Labs using the Area Quantification module. The analysis was performed only on the tumor compartment copied from the panCK slide. The software was tuned to detect positive DAB staining (brown color). The percentage of area positivity was chosen to represent the results (area positive for brown/total area) and subjected to statistical analysis using GraphPad Prism (Dunnett multiple comparisons test).
Western blotting
Tumor tissues were dissected, cut into 35–50-mg fragments, snap frozen in liquid nitrogen and stored at −80 °C. Frozen tumor fragments were homogenized in a tissue grinder (Scientz, Scientz-48) with NP-40 cell lysis buffer (Invitrogen, FNN0021). Cells cultured in vitro were washed twice with ice-cold PBS and lysed with MSD Tris Lysis Buffer (MSD, R60TX-2), and scraped and collected before centrifugation. All lysis buffers were supplemented with protease and phosphatase inhibitors (Thermo, 78444). Lysates were centrifuged at 14,000 × rpm for 10 min at 4 °C. The protein concentrations in supernatant were measured by PierceTM BCA Protein Assay kit (Thermo, 23225). Then all the lysates with equal quantities of protein were denatured at 95 °C for 10 min after adding LDS sample buffer (Thermo, NP0008) and a reducing agent (Thermo, NP0009). Samples were resolved on 4–12% Bis-Tris gels (Thermo, WG1403BOX) and western blotting was performed following the standard protocol.
The following primary antibodies were used: anti-KRAS (Santa-Cruz, sc-30), anti-pan RAS(Abcam, ab108602), anti-Ras (G12D mutant) (Thermo Fisher Scientific, MA5-36256), anti-HER2 (Cell Signaling Technology, 2242), anti-phospho-p44/42 MAPK (ERK1/2) T202/Y204 (Cell Signaling Technology, 4370), anti-p44/42 (ERK1/2) (Cell Signaling Technology, 4696 or 4695), anti-phospho-MEK1/2 Ser217/221 (Cell Signaling Technology, 9154), anti-MEK1/2 (Cell Signaling Technology, 9126), anti-Flag (Abcam, ab205606), anti-Vinculin (Cell Signaling Technology, 13901), anti-β-actin (Cell Signaling Technology, 4967) and anti-β-tubulin (Cell Signaling Technology, 86298). IRDye 800CW goat anti-mouse IgG (H + L) (Licor, 926-32210) and goat anti-rabbit IgG (H + L) HRP-conjugated (Thermo Fisher Scientific, 31462) were used as secondary antibodies.
2D cellular viability assays
Cells were plated in tissue culture-treated 384-well plates and incubated overnight. The following day, ten serial dilutions of compound were prepared in the growth medium. Cells were treated with compound or DMSO (0.1% v/v) for 5 days (T5). Luminescence was detected before treatment (T0) and after treatment (T5) using the Envision Plate Reader (PerkinElmer). Then, 25 μl of CellTiter-Glo 2.0 reagent (G9243, Promega) was added to each well. Plates were shaken at 450 rpm for 2 min at room temperature and then incubated for an additional 10 min without shaking at room temperature and protected from light. Luminescence signal from the CellTiter-Glo 2.0 reagent was normalized to DMSO treated wells (% DMSO = (lumtreated(T5)-lumDMSO (T0)/(lumDMSO (T5)-lumDMSO (T0) × 100). Data were plotted as a function of inhibitor concentration, and a four-parameter sigmoidal concentration response model was fitted.
Cell line engineering
KRASG12R overexpression cell line experiments were performed at Pharmaron. The plasmid encoding Tet-On 3G and TRE3GS-inducible Flag-tagged KRASG12R was synthesized and packaged into lentivirus at Pharmaron. Lentivirus transductions were performed with addition of Polybrene (10 µg ml−1). Lentivirus particles were added to HuP-T3 cells and incubated for 24 h after which lentivirus particles were added again to improve transduction efficiency. Then, puromycin (2 µg ml−1) was added in the culture medium to maintain selective pressure. Expression of the transgene was induced by adding doxycycline (0.1–1 µg ml−1) for at least 24 h.
AP009 KRASG12D overexpression cell line: AP009 KrasG12D/wt;Trp53null/null cell line was generated from a LSL-KrasG12D/wt mouse and maintained in adherent culture as described previously45. AP009c2 clonal cell line was isolated from parental AP009 cells with single-cell sorted by FACS. Expanded clones were confirmed with KrasG12D/wt;Trp53null/null genotype by sequencing. To generate clonal cell lines with mouse Kras overexpression, AP009c2 cells were transduced with lentivirus expressing mutant Kras G12D cDNA at optimized multiplicity of infection. On the third day after lentiviral infection cells were single-cell sorted by FACS into four 96 well plates. Expanded clones were verified by PCR and sequenced for mutant KRASG12D transgenes. Positive clones with mutant KRASG12D overexpression were evaluated by quantitative PCR using forward primer 5′-GGACTCTGAAGATGTGCCTATGGT-3′, reverse primer 5′-GCCTGTTTCGTGTCTACTGTTC-3′ and probe 5′-CCTGGTAGGGAATAAGTGTGATTTGCC-3′.
The open reading frame of mouse Kras cDNA (NM_021284.7) with KRASG12D mutation was cloned into the custom lentiviral cDNA expression plasmid pRR-mCMV-cDNA (Cellecta). Lentivirus was generated by packaging plasmids into VSV-G pseudotyped viral particles using Cellecta’s Ready-to-use Lentiviral Packaging Plasmid Mix (cat. no. CPCP-K2A). The titer of lentiviral packaged constructs provided by Cellecta is functionally determined by transduction of 293T cells.
Flow cytometry
To assess surface HER2 expression, cells were stained with 4 µg ml−1 Alexa Fluor 647-conjugated anti-human HER2 antibody (BioLegend, cat. no. 324412) and analyzed using FACScan 5. Data were processed and quantified using FlowJo software (BD Biosciences).
Bioinformatics analysis (preclinical studies)
Whole-exome sequencing analysis was performed to ascertain gene mutations. For parental cell line-derived xenograft models, gene mutation data were obtained from the 23Q4 release of the DepMap Data Portal. DNA mutation calling was accomplished with TNSeq using the hg38 version of the human genome.
Deep mutational scanning screen
DMS data were processed as previously indicated. In brief, reads were aligned to the KRASG12C reference sequence and collapsed to reads per amino acid at each position and for each amino acid substitution included in the library. Substitution not included in the library and likely PCR artifacts were removed and not considered for downstream analyses. The abundance of each allelic variant was calculated as the fraction of its read compared to the total library-wide reads in each sample independently. Variant abundances were defined as the log2 fold change (FC) between 6-day-treated time points (RMC-7977 or DMSO) and the initial variants representation at day 0 (ETP) and were computed by applying a moderated t-test as implemented in the R package limma (v.3.54.2). We defined a ‘RASi resistance’ and a fitness threshold as the average log2FC + 2 × s.d. in the RMC-7977-day 6 versus ETP and DMSO day 6 versus ETP comparisons, respectively.
Bulk-RNA sequencing analyses were performed to ascertain gene expression. Transcript-level quantification was performed using Salmon (v.1.0.8) in quasi-mapping mode. Reference transcriptome used for quantification was derived from the mouse genome (GRCm38). The transcript-level counts generated by Salmon were imported into R, and genes with low expression across the samples were filtered out before downstream analysis. Normalization of gene-level counts was performed using the trimmed mean of M-values method, which was used to calculate the log-transformed counts per million values using the CPM function from the edgeR package (v.4.2.2).
Mapping phenotypic data onto protein structures
Functional data from the DMS screen was mapped onto the structure of KRASG12C bound to GNP and in complex with RMC-7977 and PPIA (PDB: 8BTK). Graphical display was carried out using the ‘define by attribute’ and ‘render attribute’ functions implemented in Chimera X. For each residue of KRASG12C, the average log2FC of all substitutions affecting the same residue.
FISH
Fluorescent in situ hybridization was performed on either methanol acetic acid fixed in vitro cells or FFPE tumor sections using dual labeled KRAS/centromere 12 probes from Empire Genomics (KRAS-CON12-REGR).
Metaphase cells were collected from cell lines treated with 0.2 μg ml−1 Colcemid (GIBCO cat. no. 15210-040) for 4 h, trypsinized and treated with 0.075 M KCl for 20 min at 37 °C before being fixed three times in 75% methanol/25% acetic acid. Fixed cells were stored at −20 °C and then metaphase spreads were prepared on glass slides and air dried. For hybridization, slides were dehydrated in a series of ethanol (70%, 85% and 100%) for 2 min each and air dried. Probes were mixed with hybridization buffer and applied to fixed metaphase slides, covered with a 22 × 22 mm cover-glass and sealed with Cytobond (SciGene cat. no. 2020-00-1). Slides were denatured at 73 °C for 3 min and hybridized overnight at 37 °C in a Cytobrite Plus slide incubation system (SciGene) and then washed with 0.4× SSC (saline sodium citrate) + 0.3% IGEPAL, pH 7 buffer (SciGene) at 73 °C for 2 min followed by another washing with 2× SSC + 0.1% IGEPAL (SciGene) at room temperature for 2 min. Slides were quickly rinsed in water and then air dried. Cells were stained with 4,6-diamidino-2-phenylindole (DAPI) with antifade and imaged with a ×40 immersion objective on a Leica DMi8 microscope.
FFPE tumor sections were dewaxed and then treated with the Abbott FFPE Pretreatment kit to prepare the fixed DNA for hybridization. Sections were incubated in 0.2 N HCl for 20 min at room temperature, followed by incubation in sodium thiocyanate for 30 min at 80 °C and digestion with protease for 30 min at 37 °C. In situ hybridizations for FFPE sections were as described for in vitro cells, except that sections were denatured at 78 °C for 7 min.
Reporting summary
Further information on research design is available in the Nature Portfolio Reporting Summary linked to this article.



