
Implementation of a patient referral and rWGS workflow
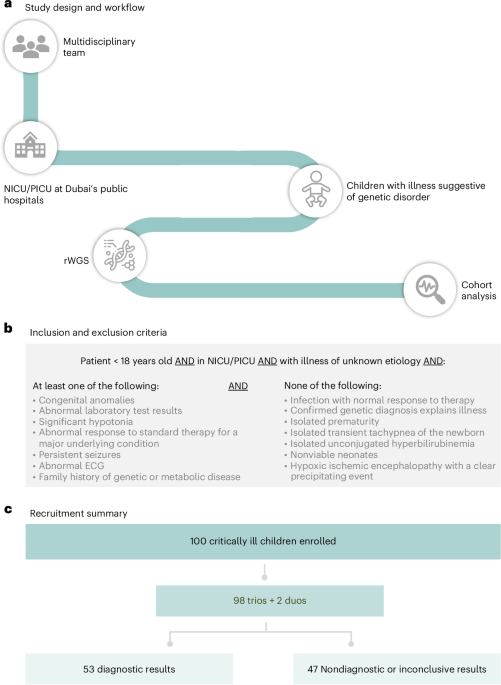
We established a cross-institutional referral network within Dubai Health to enable the implementation of rWGS for critically ill neonatal and pediatric patients (Fig. 1a). Neonatal referrals were primarily coordinated through the maternity center (Latifa Hospital), which hosts the central NICU. External referrals included ex utero and antenatal cases, with high-risk pregnancies directed to the fetal medicine center at Latifa Hospital. This enabled early identification of candidates for rWGS in the perinatal period. Critically ill pediatric patients beyond the neonatal period were referred through the central PICU at Al Jalila Children’s Hospital, ensuring coverage across the pediatric age spectrum within Dubai Health.
a, Children in NICU/PICU settings with suspected genetic disease were evaluated and recruited to a streamlined rWGS workflow overseen by a multidisciplinary clinical–genomic team. b, Clinical features used to identify NICU/PICU patients eligible for rWGS, alongside exclusion criteria applied to avoid nongenetic or clearly explained conditions (Methods). c, A flow diagram summarizing patient enrollment, sequencing structure and diagnostic outcome. HGDP, Human Genome Diversity Project; MCA, multiple congenital anomalies.
This referral workflow integrated a multidisciplinary clinical team comprising neonatologists, pediatricians and genetic counselors who jointly identified and referred eligible patients from the centralized NICU and PICU (~110 beds). Case selection was guided by predefined inclusion criteria (detailed in Fig. 1b; Methods), focusing on patients with suspected monogenic disorders where a rapid diagnosis was anticipated to inform acute clinical management. In addition to formal referral pathways, ad hoc case discussions between clinicians and the genetics team were frequently undertaken to rapidly assess eligibility. Genetic counselors were involved in all cases, while clinical or metabolic geneticists were consulted selectively on the basis of the clinical presentation and complexity of the case. Consistent with the gradual integration of rWGS and improved uptake, we observed a steady rise in patient enrollment over time (40 patients in year 1 to 73 patients in year 3) (Extended Data Fig. 1a), accompanied by a reduction in the time from admission to referral (median 7 days in year 1 to 5 days in year 3) (Extended Data Fig. 1b). The increased uptake and shorter referral interval are largely attributable to greater awareness of, and education about, the program and its inclusion criteria, as well as more established referral pathways. Eligible patients received pre-test counseling, during which a written informed consent was obtained by a genetic counselor before enrollment and sample collection.
In parallel, we established an end-to-end rWGS protocol to deliver testing within a clinically actionable timeframe under a genomic sequencing facility accredited by the College of American Pathologists (CAP). A dedicated multidisciplinary laboratory team—including molecular technologists, genomic scientists, bioinformaticians, genetic counselors and clinical molecular geneticists—was assembled to oversee all stages of the workflow following case selection. This encompassed sample processing, sequencing, bioinformatic analysis and variant interpretation in accordance with the American College of Medical Genetics and Genomics (ACMG)/Association for Molecular Pathology (AMP) guidelines, as well as integration of clinical and genomic data for diagnostic reporting. Pathogenic or likely pathogenic variants consistent with the gene-disease mechanism, mode of inheritance and patient phenotype were considered diagnostic and were often confirmed by the clinical team. To facilitate rapid clinical decision-making, results were communicated by genetic counselors to the treating clinical team immediately upon completion of analysis. Ad hoc interdisciplinary discussions were also held during the analysis phase, particularly for complex or uncertain findings, to support consensus-driven variant interpretation and clinical correlation.
The program was initially co-sponsored by Dubai Health and Illumina for enabling infrastructure development, capacity building and early implementation. Thereafter, with the continuous reduction in sequencing costs, the program is transitioning to a sustainable funding model, with government coverage for UAE nationals and support for non-nationals provided through insurance or philanthropic organizations, including the Al Jalila Foundation within Dubai Health.
This study includes data from the first 100 consented families (Supplementary Table 1). rWGS was performed as proband–parent trios (n = 98), except for two patients in which paternal samples were unavailable (and were therefore analyzed as duos) (Fig. 1c). Patients and their parents underwent short-read sequencing to an average coverage of >30× across the genome (Extended Data Fig. 2 and Supplementary Table 2).
Patient demographics and clinical characteristics
The median age at presentation was 17 days (interquartile range (IQR) 0–151 days) (47% females), with 53% being neonates and 87% less than 1 year of age (Fig. 2a). Sequencing was frequently undertaken within the first weeks of life, reflecting a predominance of early-onset, clinically severe genetic disorders that manifest at, or shortly after, birth. Among all, 62 patients were referred from the NICU while 38 were from the PICU (Supplementary Table 3). Half of patients presented with phenotypes affecting a single system, with metabolic (n = 15), neurologic (n = 10) and cardiovascular (n = 8) presentations being most recurrent, while the remainder exhibited multiple congenital anomalies (MCAs) or complex multisystemic presentations (Fig. 2b). However, we note that most patients with MCAs presented in the NICU, while relatively more patients with neurologic presentations were referred from PICU (Supplementary Table 3). Consistent with the multicultural demographics of Dubai31, self-reported parental nationalities represented 18 countries, predominantly of Middle Eastern (61%) and Asian (36%) origins (Fig. 2c).
a, Violin plots with individual data points showing the age at presentation by sex and for the overall cohort. Median age is annotated for each group and the dashed line indicates the proportion of patients presenting within the first year of life. b, The distribution of primary clinical indications prompting rWGS, categorized as single-system disorders, multisystemic disorders or MCAs. Each patient was assigned to one primary indication category. c, A sunburst plot illustrating cohort composition by ethnicity (inner ring) and nationality (outer ring). d, PCA showing study probands projected onto the HGDP reference populations. Colored circles represent HGDP superpopulations and black crosses indicate probands in this study. e, Violin plots showing the distribution of coefficients of relatedness stratified by inferred parental relationship categories: unrelated (<0.2%), shared ancestry (0.2–4%) and consanguineous (>4%), alongside the total cohort. Individual points represent probands, with medians indicated above each group. Percentages and sample counts for each category are shown along the x axis.
Source data
To explore the genetic ancestry of our samples, we projected them onto principal components generated from a reference set of Human Genome Diversity Project (HGDP) populations32 (Fig. 2d). The majority of samples clustered within the variation of Middle Eastern or South Asian populations, with a minority showing East Asian-related ancestry. A subset of samples showed notable sub-Saharan-related African ancestry, consistent with known admixture in contemporary Middle Eastern and South Asian groups33. Model-based clustering using ADMIXTURE confirmed the patterns found in the principal component analysis (PCA) (Extended Data Fig. 3).
Genomic analysis also showed that 52% of patients demonstrate evidence of parental relatedness, at variable degrees, ranging from distant shared ancestries (16.3%) to close consanguineous unions (35.7%) such as double first cousins (Fig. 2e). Parental relatedness rates among Middle Eastern families reached 52.5%, aligning with well-recognized marriage traditions in the region (Extended Data Fig. 4). Notably, Asian families scored similarly high rates (55.8%), largely driven by Pakistani families, who share similar consanguineous marriage practices34 (Extended Data Fig. 4).
Time to reporting
The median turnaround time from sample submission to reporting was 81.1 h (IQR 69.9–108.6 h), equivalent to 3.4 calendar days, with the fastest time to results being 47.7 h. Sequencing and bioinformatics analysis accounted for the largest proportion of total turnaround time (median 51.7 h, IQR 46.7–68.7 h) (Fig. 3a). Turnaround times were generally tightly clustered across samples, with limited inter-sample variability observed (Fig. 3b).
a, A schematic overview of the end-to-end rWGS pipeline, including DNA extraction, library preparation, sequencing, alignment, variant calling, annotation and clinical interpretation, with median processing times for major stages shown. b, The elapsed time for individual cases, partitioned by major workflow stages represented by different bar colors as shown in a. Panel a created in BioRender; Rabea, F. https://biorender.com/k6jv4g3 (2026).
Source data
Diagnostic outcomes
Out of the 100 enrolled patients, 53 received at least one molecular diagnosis related to the primary presentation, yielding an overall diagnostic rate of 53% (95% CI 43.3–62.5%) (Fig. 4a). The diagnostic yield was comparable between NICU (32/62; 51.6%) and PICU (21/38; 55.3%) patient groups (Supplementary Table 3). Five patients (5%) had dual molecular diagnoses where two or more pathogenic variants or genomic alterations affecting distinct loci jointly contributed to the phenotype (Fig. 4b). For instance, a 3-month-old infant (F32) admitted to the PICU owing to infantile spasms was found, within 83 h by rWGS, to harbor a homozygous pathogenic variant in SLC19A3 (HGNC: 16266) and likely pathogenic compound heterozygous variants in BTD (HGNC: 1122) consistent with thiamine metabolism dysfunction syndrome 2 (MIM no. 607483) and Biotinidase Deficiency (MIM no. 253260), respectively. Both conditions are responsive to oral biotin and thiamine therapy, highlighting both the multilayered complex diagnoses in this setting, and the importance of rWGS in supporting timely treatment plans. Among patients with dual diagnoses, phenotypes were overlapping in four patients (F20, F32, F57 and F91) but distinct in one patient (F85) (Supplementary Table 4).
a, The proportion of diagnostic, inconclusive and nondiagnostic outcomes among tested patients. b, The breakdown of cases with additional molecular findings. c, The proportion of cases achieving a molecular diagnosis within each primary clinical indication category. Percentages and numbers of diagnosed cases are indicated. Note: indications with at least five patients are displayed. d, The diagnostic yield of rWGS stratified by inferred parental relatedness categories. Percentages and counts of diagnosed cases are shown for each group. Pairwise comparisons between each relatedness category and the unrelated group were performed using two-sided Fisher’s exact tests with Bonferroni correction for multiple comparisons. Bonferroni-adjusted P values were 0.000137 (consanguineous versus unrelated), 0.000670 (consanguineous or shared ancestry versus unrelated) and 0.436 (shared ancestry versus unrelated). Statistical significance is indicated by ***P < 0.001. e, The distribution of conditions’ inheritance modes among diagnosed cases, including autosomal recessive, autosomal dominant, X-linked and chromosomal anomalies. Counts and percentages reflect primary diagnoses only (58 diagnoses in 53 patients, including 5 with dual conditions). Percentages and case counts are shown for each category. f, A sunburst plot summarizing the spectrum of detected variants, grouped by major variant class (inner ring) and specific variant types (outer ring). Percentages indicate the relative contribution of each category among all reported variants. Counts and percentages reflect variants identified within primary group diagnoses only (63 variants underlying the 58 primary diagnoses shown in e, 5 of which were due to compound heterozygous variants).
Source data
In addition, seven patients (7% of all cohort) had eight actionable molecular findings unrelated to the primary indication, including five newborn screening (NBS)-relevant findings in four patients (4%), two ACMG-designated secondary findings in two patients (2%) and an incidental finding in one patient (1%) (Fig. 4b and Supplementary Tables 1 and 4). All these patients had diagnostic variants underlying their primary disease, but were pre-symptomatic for the nonprimary conditions at the time of testing (Supplementary Table 4).
Diagnostic yield varied across clinical indication categories, with the highest observed in metabolic disorders at 80% (Fig. 4c). Yield was also statistically significant among children born to consanguineous parents, with rWGS establishing a molecular diagnosis in 80% of those cases (28/35), more than double the yield (34%) observed in children of unrelated parents (16/47) (Fisher’s exact test, P < 0.001) (Fig. 4d).
Genomic landscape
A total of 58 primary diagnoses in 53 patients (including 5 with dual findings) were reported in our cohort (Fig. 4e). Consistent with the observed parental relatedness pattern, most diagnoses (41/58 or 70.7%) were attributable to autosomal recessive conditions, mostly driven by homozygous variants (62.1%) (Fig. 4e). Recessive disorders were significantly enriched among children born to consanguineous families compared with those from unrelated unions (93% versus 50%; Fisher’s exact test, P < 0.01) (Extended Data Fig. 5). By contrast, autosomal dominant disorders represented 13.8% (8/58), with comparable distribution of inherited and de novo pathogenic variants, while X-linked conditions represented 3.4% (2/58). rWGS also identified chromosomal anomalies, ranging from small copy number changes to aneuploidies, accounting for 12.1% (7/58) of diagnoses (Fig. 4e). It is important to note that most dominant conditions and those associated with chromosomal anomalies were identified in NICU patients (Supplementary Table 3).
Of the 63 variants underlying the 58 primary diagnoses (Fig. 4e,f), single nucleotide variants (SNVs) and small insertions and deletions (INDELs) represented 84.1% (Supplementary Table 5), while larger variants constituted 15.9% (Supplementary Table 6). Of the 56 intragenic diagnostic variants (53 SNVs/INDELs and 3 small intragenic copy number variants (CNVs)), 20 were novel while 36 were previously reported, spanning 50 known disease-associated genes (Supplementary Tables 5 and 6). This distribution highlights the marked genetic heterogeneity underlying diseases in the cohort, with TRAPPC12 (HGNC: 24284) being the only gene implicated in more than one patient; the same pathogenic variant (NM_016030.6 (TRAPPC12):c.1603+5G>C;p.?) was identified in both cases.
Alongside molecular diagnostic findings, 60% of patients were carriers of at least one recessive condition, providing important reproductive screening implications in this high burden population (Supplementary Tables 1 and 5). Recurrent carrier findings involved genes associated with hemoglobinopathies and metabolic disorders, including HFE (HGNC: 4886), HBB (HGNC: 4827), MEFV (HGNC: 6998), G6PD (HGNC: 4057), GALT (HGNC: 4135) and BTD (HGNC: 1122). Furthermore, 67% of patients harbored at least one pharmacogenomic variant associated with Food and Drug Administration-approved drug responses (Supplementary Tables 1 and 7). The most frequently encountered gene was CYP2D6 (*4, *17 and *41 alleles), followed by CYP2C9 (*2 and *3 alleles). CYP2D6 alleles are known to influence metabolism across multiple therapeutic classes, including antiarrhythmics, analgesics, antipsychotics, antihypertensives, psychostimulants and selected anticancer and antidepressant agents. Conversely, CYP2C9 alleles impact dosing and toxicity risk for certain anticoagulants and antiepileptic agents. These pharmacogenomic findings were not utilized to guide clinical management in this cohort, as they were not directly relevant to patients’ acute clinical presentations at the time of testing. However, all identified variants were documented in patients’ electronic medical records to inform future relevant therapeutic decision-making.
Clinical utility
Beyond diagnostic clarification, rWGS was associated with clinically meaningful shifts in care trajectory in 53% of critically ill patients (53/100), including those with (45 out of 53; 85%) or without (8 out of 47; 17%) molecular diagnoses (Fig. 5a and Supplementary Table 1), where rWGS informed time-sensitive therapeutic, procedural and prognostic decisions during periods of substantial physiologic instability in this setting. Across the cohort, rWGS findings were associated with targeted pharmacologic or dietary intervention in 36% of patients (Supplementary Table 8), procedure- or surgery-defining decisions in 13%, consolidation of diagnostic pathways in 43%, subspeciality referrals in 37% and redirection toward palliative care in 9% (Fig. 5b and Supplementary Table 1).
a, The proportion of cases in which rWGS findings led to changes in clinical management, stratified by diagnostic and nondiagnostic results, versus no change. b, A heat map summarizing the types of clinical actions influenced by rWGS results. Rows represent individual cases (with case number and affected gene/locus shown on the side), with color indicating whether changes were driven by positive or negative rWGS findings. Aggregate proportions of cases within each management category, out of the overall cohort, are shown on top. AND, allowing natural death.
Source data
To further assess the impact of rWGS on care management, we adapted the recently published Clinician-reported Genetic testing Utility InDEx questionnaire in ICU (C-GUIDE ICU) to score impacts across ten clinical domains (0–2 points per domain, with higher scores correlating with higher clinical utility) for each patient35. Clinical domains included timely diagnostic, prognostic, therapeutic and management insights (Methods; Supplementary Table 9). Cumulative scores across the cohort ranged from 2 to 16, with a median of 9. Scores were consistently higher among genetically diagnosed patients relative to those who were undiagnosed (median 12 versus 2, P < 0.00001), suggesting that, overall, rWGS translated diagnostic resolution into immediate therapeutic and prognostic action during periods of critical physiologic vulnerability.
In addition to improving care trajectories in 53% of patients, rWGS led to immediate changes in disease trajectories in 16% of patients, where rWGS-triggered management plans led to favorable outcomes (8%) or end-of-life decisions (8%). We summarize all those cases in Supplementary Table 10 and we here highlight illustrative examples. In a 2-week-old ventilator-dependent newborn with recurrent apneic episodes (F42), rapid identification of a pathogenic variant in PHOX2B (HGNC: 9143) established congenital central hypoventilation syndrome (MIM no. 209880) within 72.7 h, permitting early definitive airway planning and transition from recurrent reactive attempts at stabilization to structured long-term ventilatory management.
In an 18-day-old infant with persistent severe hypoglycemia requiring high-concentration dextrose infusion (F64), genotype-directed classification of ‘focal’ ABCC8-associated disease by rWGS within 55 h supported early definitive surgical intervention, to remove focal pancreatic lesions, without prolonged empiric medical management, limiting sustained exposure to reliance on high-concentration glucose infusion and predisposition to potential recurrent hypoglycemic instability during the diagnostic interval.
In a 2-month-old infant presenting with abdominal distention, adrenal calcifications and evolving disease deterioration (F81), rWGS established a Wolman disease (MIM no. 620151) diagnosis due to a homozygous exonic deletion in the LIPA gene (HGNC: 6617) within 50.6 h. This enabled initiation of enzyme replacement therapy and dietary modification even before completion of conventional biochemical testing. Untreated infantile Wolman disease is characterized by rapidly progressive hepatic dysfunction, intestinal failure, systemic inflammatory complications and high mortality within the first year of life. Early initiation of disease-modifying therapy during this critical phase stabilized clinical progression and redirected management toward sustained enzyme replacement-based care rather than progression toward the expected fulminant course.
rWGS also provided prognostic clarification in severe neurodevelopmental disease. In a newborn with hydranencephaly and complex congenital anomalies (F77), identification of a homozygous pathogenic variant in TRAPPC12, within 80 h, established a progressive encephalopathy (MIM no. 617669) with poor anticipated neurologic outcome. Rapid genomic confirmation informed timely goals-of-care discussions and alignment of treatment intensity with expected disease trajectory, avoiding escalation of invasive life-sustaining interventions unlikely to alter outcome.
Clinical impact was observed not only in patients with positive diagnoses but also in a subset with negative genomic results (n = 8), where exclusion of a monogenic etiology narrowed the differential diagnosis and curtailed further invasive investigation. In a 5-month-old infant (F44) (Supplementary Table 1) on diazoxide therapy for presumed hyperinsulinemic hypoglycemia, rWGS results were negative, within 89.7 h, ruling out possible implicated genes and confirming a diagnosis of a nongenetic transient neonatal hyperinsulinemia, leading to diazoxide discontinuation, and avoiding additional diagnostic evaluations in this infant whose glucose levels gradually normalized.
Finally, beyond direct impact on patient management, the autosomal recessive inheritance pattern of the diagnostic variants in most positive families (~70% of all positives and 93% of those who are consanguineous), in our context, enabled reproductive counseling of parents who were offered pre-implementation genetic testing or prenatal diagnosis to mitigate the 25% recurrence risk for future affected pregnancies.
rWGS versus standard-of-care testing
To compare the diagnostic efficacy (yield and time-to-diagnosis) and clinical utility of rWGS to that of standard-of-care testing in critically ill patients, we established a retrospective control cohort of infants and children (n = 100) admitted to the NICU/PICU during the period preceding rWGS implementation (2018–2022) (Supplementary Table 11). Patients were randomly selected from a group of critically ill patients who were referred for genetic testing from NICU/PICU and whose clinical presentations suggest a possible genetic etiology according to the eligibility criteria for rWGS. This selection process was otherwise blind to all other variables, including genetic and clinical outcomes.
The median age at presentation in this control group was 7 days (IQR 0–107 days), with 89% being under the age of 1 year, and with equal sex distribution (53% females and 47% males) (Fig. 6a). The spectrum of clinical indications was comparable to the rWGS cohort, with 54% presenting with single-system disorders and 46% presenting with multisystem disorders or multiple congenital anomalies (Fig. 6b and Supplementary Table 12). Similarly, ethnic composition was primarily Middle Eastern and Asian at 69% and 22%, respectively (Fig. 6c). No statistically significant differences were observed between the rWGS and control cohorts across these demographic and clinical variables (Supplementary Table 12).
The rWGS and control cohorts each comprised 100 independent patients (n = 100 per cohort). All analyses were performed at the patient level, with each observation representing one patient; no technical replicates were included. a, Violin plots with individual data points show age at presentation by sex and for the overall control cohort. Median age is annotated for each group and the dashed line indicates the proportion of patients presenting within the first year of life. b, The distribution of primary clinical indications prompting genetic testing in the control cohort, categorized as single-system disorders, multisystemic disorders or multiple congenital anomalies. Each patient was assigned to one primary indication category. c, The distribution of the control cohort by broad self-reported ethnic grouping. d, The number and type of genetic tests performed per patient in the control cohort. Each vertical bar represents one patient, and stacked segments indicate the types of tests performed. e, The diagnostic turnaround time (days) in the rWGS and control cohorts. Box plots show the median (center line), IQR (bounds of box represent the 25th–75th percentiles) and minimum and maximum values (whiskers). Groups were compared using a two-sided Wilcoxon rank-sum test; P < 2.2 × 10⁻¹⁶. Statistical significance is indicated by ***P < 0.001. f, The diagnostic yield comparison between the rWGS and control cohorts. Percentages of diagnosed cases are shown for each cohort. Groups were compared using a two-sided Fisher’s exact test; P = 0.0015. Statistical significance is indicated by **P < 0.01. g, A comparison of the proportion of patients in whom genetic testing resulted in a change in clinical management between the rWGS and control cohorts. Groups were compared using a two-sided Fisher’s exact test; P = 3.4 × 10⁻⁷. Statistical significance is indicated by ***P < 0.001.
Source data
Diagnostic evaluations in the control group often involved multiple, sequential genetic tests spanning different strategies. While most patients underwent one investigation, 23% required additional tests, often progressing from cytogenetic analysis to exome-based sequencing approaches (Fig. 6d). This testing paradigm was associated with significantly prolonged diagnostic timelines (median 38 days (IQR 23–53 days) versus 3.4 days (IQR 2.9–4.5 days); Mann–Whitney U test, P < 0.001) and lower diagnostic yield (30% (95% CI 21.3–40.2%) versus 53% (95% CI 43.3–62.5%); Fisher’s exact test, P < 0.01) relative to rWGS (Fig. 6e,f). Changes in clinical management were also significantly lower in control cases relative to the rWGS cohort (18% versus 53%, 95% CI for controls 11.1–27.4%, P < 0.001) (Fig. 6g). Compared with patients who received rWGS, the C-GUIDE ICU scores were also significantly lower in control cases (median 9 versus 0, P < 0.00001) (Supplementary Table 9), highlighting the added impact of rWGS on clinical management in intensive care units.



