
Study design
This prospective, single-center observational study developed and evaluated a real-time patient–data interface in a level 4 EMU at the Hospital of the University of Pennsylvania. The study was approved by the University of Pennsylvania Institutional Review Board (protocol 849276) and written informed consent was obtained from all participants before any study procedure. We recruited patients admitted to the EMU for seizure characterization as part of clinical management or presurgical evaluation. Enrollment was reported during the clinical admission and coincided with the duration of continuous video-EEG monitoring, without altering standard-of-care monitoring or treatment. Because this proof-of-concept platform was intended to demonstrate per-patient feasibility rather than a population-level effect, we prespecified a target of 10–15 EMU patients based on feasibility and patient availability during the study period, rather than by a formal power calculation. Participant sex, race and ethnicity were self-reported and are summarized in Table 1. Sex and gender were not used as variables in the study design and the study was not powered for sex-based or gender-based analyses.
The implementation and clinical use of AI in this study were reviewed and approved by the Penn Medicine AI Governance Committee, an expert body established for this project that has since been institutionalized, the Penn Medicine Information Services Architecture Review Board and a Penn Medicine Security Risk Assessment. Together, these bodies required that all model inference and computation should be performed within HIPAA-compliant infrastructure, that the LLM endpoint be contractually prohibited from training on or retaining any data, and that all patient–AI interactions undergo daily human review. Committee composition, review scope and the multitrack governance process, which we share as an example for other institutions navigating the heterogeneous policies on cloud-based clinical AI, are described in the Supplementary Methods.
Procedures
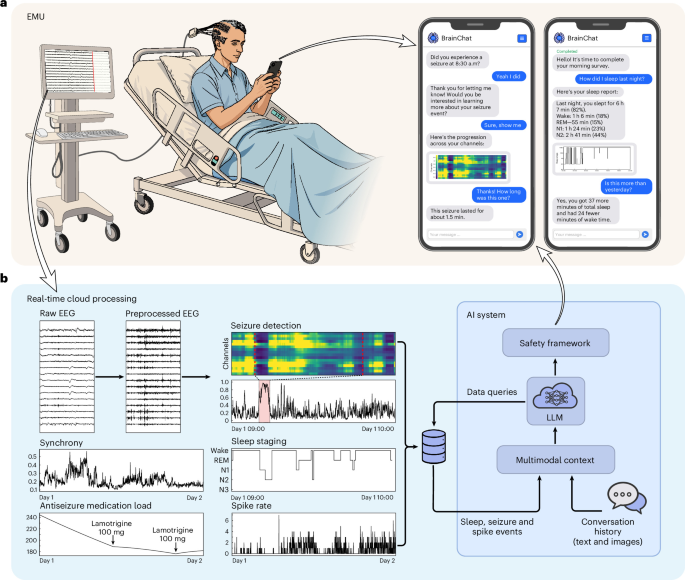
Expert epileptologists screened incoming EMU admissions for eligibility. Eligible patients were ≥18 years of age, with intact capacity to provide informed consent and interact with an app on a smartphone and English proficiency adequate for study procedures. We excluded patients with self-reported pregnancy or nursing, cognitive impairment or language barriers precluding meaningful engagement, or refusal or withdrawal of consent. On the day after admission, a research coordinator obtained informed consent and activated the NeuroWorks software development kit (SDK; Natus) on the patient’s acquisition workstation to allow real-time EEG data streaming. Each patient was provisioned a study account with a unique username and password, data-stream linkage identifier, medical record number for medication log integration and an EEG modality designation (scalp or intracranial) that configured model parameters. The coordinator installed the application as a progressive web app on the patient’s smartphone, authenticated the patient, enabled push notifications and demonstrated key app features, including seizure and spike alerts, morning sleep reports and scheduled survey questionnaires. Throughout their hospitalization, patients were encouraged to ask questions through the chat interface and respond to surveys and messages through the app, and the coordinator reviewed message histories at least daily. Patients were informed that this system is a research prototype in which false-positive seizure detections were anticipated, and that all clinical seizure concerns should be directed to their care team. Patients received $25 per day of participation. Accounts were deactivated on the day of discharge after completion of the exit survey (Supplementary Table 7) and clinical data were aggregated for research use under the approved protocol. Figure 1 provides an overview of the study platform.
Platform implementation
Overview
The platform comprised the following three interconnected systems (Fig. 2a): (1) an on-premises data acquisition and relay layer that exported real-time EEG data and metadata from EMU recording stations; (2) a HIPAA-compliant cloud analytics environment that ingested, preprocessed and analyzed streaming data and persisted features and events in databases; and (3) the patient-facing app with integrated conversational AI that delivered clinical event notifications and surveys and allowed patients to ask questions about their own physiological data. A PostgreSQL database backed the application state and messaging history, and a LangGraph-based AI agent system orchestrated data queries against a Databricks Unity Catalog through a cloud-hosted, HIPAA-compliant LLM. We chose GPT-4o-mini (version 2024-08-01-preview) because it was, at the time of study initiation, the only model in Penn’s HIPAA-compliant Azure OpenAI tenancy with sufficient instruction-following and tool-use reliability for our constrained, retrieval-oriented task, at substantially lower latency and cost for continuous usage than larger contemporary models. Its smaller capacity makes it less suited to clinical reasoning, but the AI’s role was deliberately scoped to information delivery and structured data retrieval rather than autonomous clinical judgment. The modular architecture allows the underlying model to be substituted as more capable HIPAA-compliant options become available. We did not specifically train or fine-tune the LLM, nor use rolling LLM-generated summarization. Each node in the AI system used a dedicated system prompt (Supplementary Table 10).
Real-time EEG data acquisition and streaming
Continuous scalp and iEEG signals were acquired using clinical Natus systems at 256 and 1,024 Hz, respectively, and automatically downsampled to 512 Hz during transmission. The Natus NeuroWorks SDK provided real-time access, exposing ZeroMQ sockets for data, study information and event injection on the hospital network. A cloud-hosted virtual machine subscribed to the hospital-side publishers, retrieved sampling and channel metadata through the SDK and batched raw samples into 1-s windows. Batches were compressed (gzip), base64 encoded, annotated with channel names, timestamps and patient identifiers and forwarded to Azure Event Hubs using shared-access-signature authentication. Our configuration had four throughput units, each supporting up to 1 MB of data or 1,000 events per second, with automatic scaling during periods of high input volume. Given that a 1-s EEG packet is estimated to be 0.03–0.04 MB for scalp EEG and 0.35 MB for 250-channel stereoelectroencephalography (SEEG), the system can support at least 10 SEEG patients or 100 scalp EEG patients concurrently. Event Hubs fed a Databricks streaming pipeline that performed canonical EEG preprocessing, feature computation and model inference, writing outputs to Delta tables within a Unity Catalog.
Cloud data processing and feature extraction
Preprocessing
EEG signals were bandpass filtered (0.5–100 Hz for scalp EEG, 0.5–250 Hz for iEEG) and notch filtered at 60 and 120 Hz to suppress powerline noise. Bad channels were identified using a validated, custom artifact rejection algorithm (Supplementary Methods) and excluded before rereferencing to common average (CAR) or bipolar montages, as required by specific algorithms. Bipolar pairs rendered unavailable due to bad channels were retained but labeled as contaminated. Rereferenced signals were then prewhitened. Data from each stage were stored in dedicated Delta Live Tables on Databricks (Supplementary Tables 2 and 3).
Scalp EEG seizure detection
For scalp recordings, we used SPaRCNet12, a seizure-detection model trained on over 6,000 EEG recordings from 2,711 patients to distinguish among six types of ictal-interictal injury continuum patterns. Per model design, inputs were 10-s windows of bipolar data with 2-s overlap. A segment was considered a seizure if the probability of the lateralized periodic discharges (LPD) class exceeded a data-adaptive threshold, defined as the mean seizure probability of +1.2 s.d. over a 400-s sliding window with a 100-s stride. We used the LPD class instead of the seizure class due to its empirically higher sensitivity, potentially reflecting misclassification of seizure segments as LPD. We then used a cumulative sum strategy where a cumulative statistic was calculated as:
$$S\left(t\right)=\max \left(0,S\left(t-1\right)+P\left(t\right)-k\right)$$
(1)
where P(t) denotes the seizure probability at time t, and k represents the adaptive threshold. A seizure detection was declared when S(t) exceeded the decision threshold (h = 3). The parameters were empirically selected based on validation results from an independent EMU dataset. The detected samples were subsequently smoothed using binary opening and closing operations. Consecutive detections separated by less than 2 s were merged, and merged events shorter than 10 s were discarded, as seizures typically last longer than 10 s.
iEEG seizure detection
For intracranial data, we evaluated both WaveNet13 and ONCET (William K. S. Ojemann, unpublished work) during inference and selected ONCET for fine-tuning based on its superior performance. WaveNet uses causal, dilating convolutional layers trained to discriminate between seizure and nonseizure neural activity. It accepts single-channel EEG data as input and adapts to variable channel counts in iEEG recordings. Following the inference pipeline described in the original publication, 1-s segments of bipolar, prewhitened data were downsampled to 128 Hz and normalized using a robust scaler fitted on nonictal segments. Sensitivity analyses demonstrated minimal performance differences across scaler fitting durations from 1 to 20 min, so we used the first 10 min of available data. ONCET is a seizure-annotation model trained on more than 1 million clips of single-channel iEEG recordings of interictal, seizure onset and seizure spread activity from 87 patients28. It uses dilating residual convolution blocks with expanding receptive fields, attention and feature compression to classify ictal activity, achieving an area under the receiver operating characteristic curve (AUROC) of 0.94 on the held-out test set and 0.95 on a gold-standard validation set29. ONCET inference follows similar preprocessing steps to WaveNet but operates on data downsampled to 256 Hz by default. We obtained per-channel detections using a data-adaptive threshold of mean + 0.8 s.d. and a cumulative strategy with h = 3. A sample was classified as seizure if more than 10% channels were predicted as seizure.
Additional features
We detected scalp EEG spikes using SpikeNet14 and iEEG spikes using a separate validated detector15. Sleep was staged with YASA16 or, when central channels were unavailable, alpha–delta ratio was used as an alternative measure. Brain-wide phase synchronization was computed from Hilbert-transformed CAR data as a global synchrony index and total ASM plasma concentration was estimated from medication dosing records using a first-order pharmacokinetic model recently validated by our group30. Identified events were visualized as heatmaps, animated head topographic maps, hypnograms and line plots for presentation to patients (Fig. 1). Window sizes, montages, thresholds, event definitions and visualization details for each feature are provided in Supplementary Tables 2 and 3 and Supplementary Methods.
Patient-facing application
The application was a containerized Python Flask service served by Gunicorn and deployed to Azure App Service, providing authentication, a chat interface and push notifications (web push protocol with VAPID). A dedicated Azure Database for PostgreSQL stored patient authentication information, conversations, surveys, synchronized seizure and spike events, and cached images linked from Databricks volumes. A background scheduler (APScheduler) polled Databricks tables at 30 s intervals to synchronize new events and dispatch daily sleep reports once morning surveys were completed. To restrict patient interactions to high-confidence detections, the scheduler retrieved only scalp events with mean probability of ≥0.80 and maximum probability of ≥0.95, and iEEG events exceeding 1 min in duration. Push notifications for clinical events were disabled overnight (21:00–08:00), but these events remained accessible to patients using data queries. Images (for example, sleep staging hypnograms and seizure heatmaps) were retrieved from Databricks volumes through the Files API, cached under application-controlled storage and displayed in-line within the chat history.
The following three bidirectional data flows linked the patient application and the cloud analytics environment: (1) patient-initiated queries with secure structured query language (SQL) filtering returned personalized clinical event summaries (for example, historic seizure characterization) to the chat; (2) system-initiated alerts synchronized detection events to the application, triggering push notifications; and (3) patient-in-the-loop annotations captured patient responses to these events and persisted them in Databricks for iterative model retraining.
Conversational AI
The conversational AI (Fig. 2b) was implemented as a directed state machine using LangGraph, with nodes for message moderation, routing based on classified patient intent (‘general chat’ versus ‘data agent’ query), conditional message evaluation and clarification, and a ReAct-style ‘data agent’ with an iterative tool loop31. The persistent state maintained conversation history, patient context (unique identifier, EEG type, sleep-monitoring status), routing flags, moderation results and SQL query metadata. All SQL queries ran through a custom tool that injected a patient-specific filter for data isolation and matched database table semantics. To manage context and reduce token usage, chat history was truncated to a fixed sliding window of the most recent 200 messages, with images stripped to descriptive text placeholders before being passed to the moderation and ‘data agent’ nodes. The ‘data agent’ had a bounded iteration loop (up to 25 tool calls) and returned an automated message on recursion or validation failures.
Each patient was provisioned a separate application account and conversation thread, with database access constrained server-side by that patient’s unique identifier. Conversation state, message routing flags and moderation results were likewise scoped to the individual patient, so no patient’s conversation history or clinical data could enter another patient’s session. Because the LLM is stateless across calls, each node’s system prompt, defining its role, scope and constraints, was re-injected on every turn rather than relying on the model to retain it, keeping behavior consistent even as older messages left the 200-message window. That window also bounded input size, preventing token-limit overflow that could otherwise truncate context unpredictably and degrade response quality over a prolonged conversation.
To mitigate hallucinations and unsafe content in a clinical setting, the AI system used the following multilayered safeguards: (1) an input moderation node evaluated every incoming patient message against an LLM-judged rubric (Supplementary Table 10) before it reached the conversational AI; (2) an output moderation node applied the same rubric to every LLM-generated response before patient delivery; (3) an LLM-based intent router classified whether a message was handled by ‘general chat’ or by the ‘data agent’, and only ‘data agent’ executed SQL queries against the Databricks Unity Catalog, logging each generated query and its result alongside the response so that every numerical claim about patient data could be audited against the underlying database; and (4) an investigator reviewed message histories at least daily for safety validation.
Predeployment red-teaming was conducted iteratively as part of AI system development—investigators attempted to elicit unsafe or off-protocol behavior, inspected the resulting traces to localize failures within the multinode tool-calling pipeline and refined system prompts, tool-calling logic and moderation criteria until adversarial probes no longer elicited inappropriate behavior. Any message flagged by either moderation node was obfuscated from the patient (and, for input moderation, from the conversational AI) and routed for immediate human review. The patient-facing system reflects the converged endpoint of this iterative hardening, which is described in full in the Supplementary Methods.
Surveys
The application administered three daily surveys—morning (08:00–09:00), afternoon (14:00–15:00) and evening (20:00–21:00)—as well as a one-time exit survey at study completion. Delivery times were randomized per patient within each window to reduce anticipatory bias. Each survey contained ten questions (0–100 visual analog scale with labeled endpoints), two for each of the five constructs—depressed mood, anxiety, perceived cognitive function, stress level and fatigue/energy level. These items are brief, author-constructed visual analog scale ratings designed for high-frequency in-app administration; they are not validated epilepsy-specific patient-reported outcome instruments and are reported here only as feasibility and engagement signals (response rates and directionality). The morning survey included five additional items from the Richards–Campbell Sleep Questionnaire32 assessing sleep depth, latency, wakefulness, maintenance and overall quality. The exit survey comprised the 10-item System Usability Scale18 (five-point Likert) and four free-text questions on system utility and patient feedback. Follow-up questions were generated under prespecified conditions—one fixed, open-ended question after morning surveys about factors affecting sleep and up to three personalized questions after afternoon and evening surveys when responses showed notable day-to-day changes, monotonic trends or sustained extremes, with at most one follow-up per construct. Follow-up questions were LLM generated and expired after 1 h; surveys themselves expired if not completed within 3 h of being administered. Full survey questionnaires are provided in Supplementary Tables 4–7.
Interaction and engagement analysis
To quantify patient engagement and system performance, we calculated response latencies for both the AI system and patients. System response latency was the interval between a patient’s message and the subsequent AI response. For survey follow-up questions generated by the LLM, it was measured from the survey completion to the delivery of the first follow-up question. Patient response latency was categorized by interaction type—for ‘general chat’, latency was measured from the delivery of an AI message to the first subsequent patient message; for surveys, latency was defined as the time from notification delivery to the patient initiating the survey; and, for seizure and spike events, latency was calculated from the time of notification delivery to the patient’s annotation of the event. Automated (non-AI-generated) messages were excluded from the message logs before analysis. Message router accuracy (Fig. 3e, left) was evaluated by manual review of each patient message to determine whether it had been classified and routed to the appropriate downstream node (‘general chat’ or ‘data agent’). ‘Data agent’ accuracy (Fig. 3e, right) was determined by inspecting the SQL query generated for each ‘data agent’ turn and verifying that the retrieved data and the synthesized response correctly answered the patient’s question.
Model fine-tuning
Patient-in-the-loop fine-tuning
We implemented real-time model fine-tuning every 3 h separately for each patient. Patient annotations were converted into binary labels time aligned with model predictions—a window was labeled 1 if it overlapped with any patient-confirmed seizure event and 0 otherwise, while model-detected events without corresponding annotations were labeled ‘Not a Number’ and excluded. Fine-tuning was skipped for any 3-h session with no detected events or when all detected events lacked valid annotations.
Samples were split into training and validation sets with an 85-to-15 ratio. To preserve representation of rare positive cases, we adopted a stratified temporal split in which the first 85% seizure and nonseizure samples were assigned to the training set and the remaining 15% to the validation set. Fine-tuning was also skipped if the validation AUROC exceeded 0.98, indicating near-perfect performance, or was below 0.5, suggesting potentially incorrect patient annotations. For SPaRCNet, the Kullback–Leibler divergence over the six-class output distribution was used as loss. For ONCET, channel-level seizure probabilities were aggregated using a top-k pooling strategy, as only sample-level labels (without channel-wise annotations) were available. Given channel probabilities \({{p}_{c}}_{c=1}^{C}\), the aggregated probability:
$$\hat{y}=\frac{1}{k}\sum _{i=1}^{k}{p}_{\left(i\right)},$$
(2)
where p(1) ≥ p(2) ≥ … ≥ p(C) denotes the sorted channel probabilities in descending order and k was set to 10% the total number of channels. A binary cross-entropy loss was then computed between the ground-truth label and \(\hat{y}\). Given the substantial class imbalance toward nonseizure samples, we incorporated model distillation to mitigate collapse to the negative class by introducing an additional supervision loss defined as the Kullback–Leibler divergence between the original model’s predictions and those of the fine-tuned model, weighted by a factor of 0.5.
Fine-tuning used an optimizer with a learning rate of 5 × 10⁻⁶ and weight decay of 1 × 10⁻³, class-balanced resampling, channel-flipping augmentation for SPaRCNet and partial layer freezing with a progressive unfreezing schedule. Training ran for up to 20 epochs with checkpointing and early stopping. Full optimization settings and stopping criteria are provided in the Supplementary Methods.
Clinician-in-the-loop fine-tuning
Deep active learning identified the most informative portions of each day’s EEG recording for clinician annotation, enabling continuous refinement of the detection model with efficient expert input. At the end of each day, the model performed inference on the full day’s recording, and a least-confidence sampling strategy selected ten 90-s segments for which the model showed the greatest uncertainty. Clinicians reviewed and labeled these segments and the annotations were used to fine-tune the model. The model backbone was partially unfrozen using the same configuration as the patient fine-tune, and model distillation was applied with a weighting factor of 0.5. The updated model was then deployed for seizure detection on the subsequent days’ recordings.
Performance evaluation
We evaluated fine-tuned models post hoc to determine whether fine-tuning improved seizure detection on subsequent data. We first validated the approach using patient-initiated push-button alarms in the EMU instead of patient responses through the system, treating the period from 1 min before to 2 min after each alarm as a seizure event and all remaining periods as nonictal. This enabled evaluation in a larger cohort, including patients recruited before the interactive seizure-annotation feature was available. Seizures annotated by EMU clinicians were used for clinician-in-the-loop fine-tuning and served as the ground truth. All annotations were converted into binary labels time aligned with model predictions. The model was fine-tuned sequentially at multiple time points and its performance on subsequent data not used for fine-tuning was compared to the baseline (Fig. 5a). We also evaluated performance across the entire EMU stay by applying the fine-tuned models once they became available. Performance metrics were computed using the SzCORE framework33, including event-level seizure sensitivity, false alarms per hour and event-wise F1 score, AUROC and area under the precision-recall curve. During evaluation, seizure events separated by less than 90 s were merged and events longer than 5 min were split into separate events. A seizure event was considered detected if any predicted event overlapped with it, with a 30-s preictal tolerance and a 60-s postictal tolerance.
We then evaluated prospective fine-tuning using patient-provided annotations collected through the system. For safety, only the validated baseline model was deployed during actual patient sessions to avoid issuing inaccurate alarms that could affect the patient. To approximate real-time application, we performed a pseudoprospective analysis in which the model was sequentially fine-tuned, mirroring live deployment. Patient annotations were converted to labels as described above, and all other evaluation procedures followed the validation analyses.
Statistical analysis
To assess the association between synchrony and ASM load, we applied a linear mixed-effects model using restricted maximum likelihood estimation, with total ASM load as the dependent variable, synchrony and α-to-δ ratio as fixed-effect predictors and patient as a random effect. System response latencies between the ‘general chat’ and ‘data agent’ interaction modes were compared using a two-sided Mann–Whitney U test. Seizure-detection performance was summarized using medians and IQRs. For each fine-tuned model, we computed the performance difference relative to the baseline model on future test data (Fig. 5a). The median performance difference across all fine-tuned models was aggregated within each patient and these medians were compared to zero using a one-sided Wilcoxon signed-rank test, with the alternative hypothesis set according to the expected direction of effect. We also compared performance across the EMU stay between the baseline model and the simulated prospective fine-tuning approach, where the most recent fine-tuned model was deployed, using a one-sided paired Wilcoxon signed-rank test. To reduce multiple comparisons, statistical tests were limited to false alarm rate and F1 score. Rank-biserial effect sizes (r) and 95% CIs were reported for all Mann–Whitney U and Wilcoxon tests. Multiple comparisons were corrected using the Benjamini–Hochberg procedure, with adjusted P values <0.05 considered statistically significant.
Analyses were performed in Python (v3.10+). The interaction-mode response latency comparison was computed using SciPy (v1.16.3), NumPy (v2.3.3) and pandas (v2.3.3). Seizure-detection performance was compared using one-sided Wilcoxon signed-rank tests (SciPy; v1.16.3), with Benjamini–Hochberg correction applied using statsmodels (v0.14.4). Model fine-tuning used PyTorch (v2.6.0) and scikit-learn (v1.7.2). All study and analysis code with pinned dependency versions are available in the public repositories listed under Code availability.
Reporting summary
Further information on research design is available in the Nature Portfolio Reporting Summary linked to this article.



