
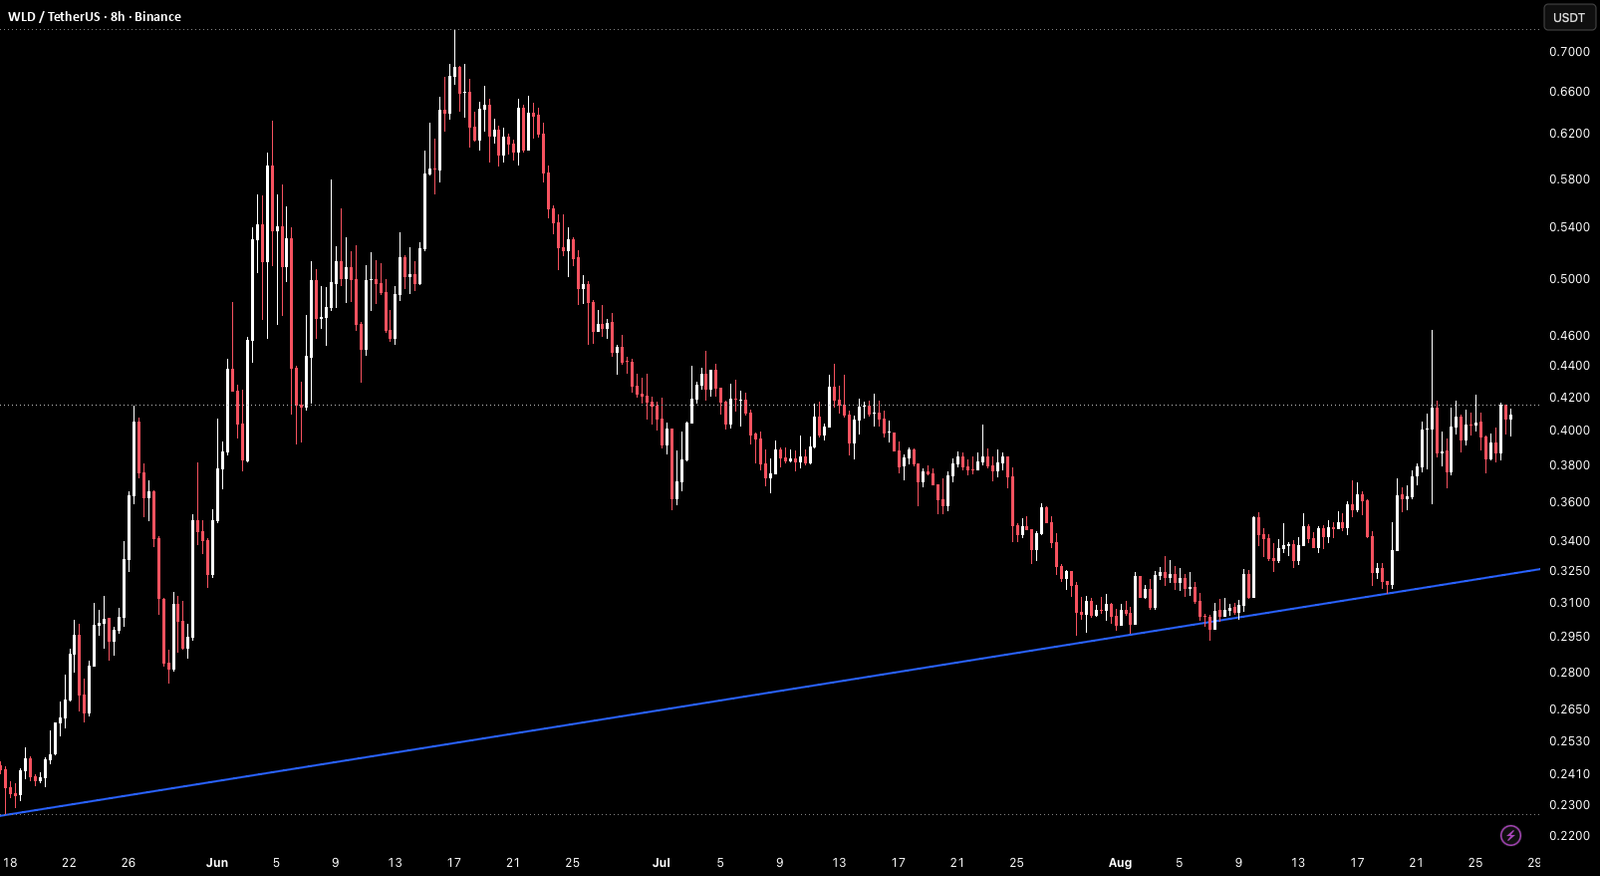
The chart shows a rising trendline originating from the late May low near 0.2220, connecting the June 8 low near 0.2530 and continuing to climb into the 0.3200–0.3250 area currently. Price spiked from that trendline in early June to a high near 0.7000 before collapsing sharply back through 0.5000, 0.4400, and 0.4200 in a near-complete retrace of the move. The post-spike decline eventually brought price back to the rising trendline near 0.2950–0.3100 in late July where it found support and the current recovery began. The horizontal level near 0.4000–0.4200 has been the most consistent pivot on this chart across the entire visible structure, acting as support before the spike, as resistance after the spike collapse, and now as the ceiling of the current recovery. Price has pushed from the trendline through 0.3200, 0.3600, and into the 0.4000–0.4200 zone where multiple prior recoveries have stalled.
The 0.4000–0.4200 zone has rejected every meaningful recovery attempt since the spike collapsed, making the current test the most watched level on the chart and the key determinant of whether the trendline bounce produces a sustained recovery or repeats the prior rejection pattern.
Key Levels To Watch
→ 0.6600–0.7000 Spike high, major resistance above
→ 0.5200–0.5400 Prior spike consolidation, resistance
→ 0.4400–0.4600 Mid-range resistance zone
→ 0.4000–0.4200 Horizontal pivot, current resistance test
→ 0.3600–0.3800 Minor support, prior recovery zone
→ 0.3200–0.3250 Rising trendline, dynamic support (climbing)
→ Below 0.2950 Trendline breakdown, macro structure at risk
A confirmed break above 0.4000–0.4200 and follow-through toward 0.4400–0.4600 would signal the first meaningful structural shift since the spike collapse, opening a recovery toward the mid-range zone and potentially 0.5200–0.5400 on continuation.
A rejection at 0.4000–0.4200 and a return toward the rising trendline near 0.3200–0.3250 would continue the pattern of failed recoveries at this level, and a confirmed close below the trendline would break the macro support floor that has held every low since May.
Trendline recovery pressing into the most tested resistance on this chart. Break above 0.4200 → first sustained recovery, eyes on 0.4400–0.5200. Reject here → prior pattern repeats, trendline near 0.3200 next. Bias cautiously bullish above rising trendline. Shift only on confirmed close below 0.3200–0.3250.



