
Study design and data source
We used EHR data from the TriNetX US Collaborative Network covering approximately 60 healthcare organizations (HCOs) and including data from more than 100 million patients16,17,18,19. Available data include demographics, diagnoses and medications. This study complies with Strengthening the Reporting of Observational Studies in Epidemiology (STROBE) guidelines and the Guidelines for Accurate and Transparent Health Estimates Reporting (GATHER) statement.
Acquisition of data, quality control and other procedures
Some descriptions of the TriNetX platform and its data quality procedures in this section are adapted from our previous studies that used the same network6,16. These studies provide more detail on how the network operates and how data flow from HCOs to the network. The available data modalities include demographics (encoded to HL7 v.3 administrative standards), diagnoses (International Classification of Diseases, 10th Revision, Clinical Modification (ICD-10-CM)), procedures (International Classification of Diseases, 10th Revision, Procedure Coding System (ICD-10-PCS) or Current Procedural Terminology (CPT)) and measurements (Logical Observation Identifiers Names and Codes (LOINC)). A typical HCO contributes approximately 9 years of historical data, occasionally extending to 15 years.
Mortality data
Mortality is ascertained from the EHR, which reliably records in-hospital deaths and captures some deaths occurring outside hospital; for a subset of patients, coverage of out-of-hospital deaths is improved by linkage to third-party sources (the Social Security Administration, private obituary records and private claims data).
Ethics
TriNetX’s networks are compliant with the Health Insurance Portability and Accountability Act (HIPAA), the US federal law that protects the privacy and security of healthcare data. TriNetX is certified to the ISO 27001:2013 standard. All data accessible through the platform are deidentified in accordance with the HIPAA Privacy Rule (§164.514(b)(1) and §164.514(a)), with deidentification certified by a qualified statistical expert. On the basis of this expert determination, TriNetX is exempt from institutional review board (IRB) oversight. Participating HCOs supply data under Business Associate Agreements and warrant that they hold the rights and approvals required to do so, on condition that the contributing organizations remain unidentified and that the data are used solely for research. Keeping the identity of participating HCOs from the researchers using the data also contributes to complying with legal frameworks and ethical guidelines guarding against data reidentification. Because this study used only deidentified data, IRB approval and informed consent were not required, and no IRB protocol number applies.
Assumptions for causal inference
Our study design can be formalized within an instrumental-variable framework, in which vaccination timing serves as an instrument for vaccine type. The five identifying assumptions of this framework for causal inference, together with the supporting evidence we provide, are as follows:
Relevance (assumption 1)
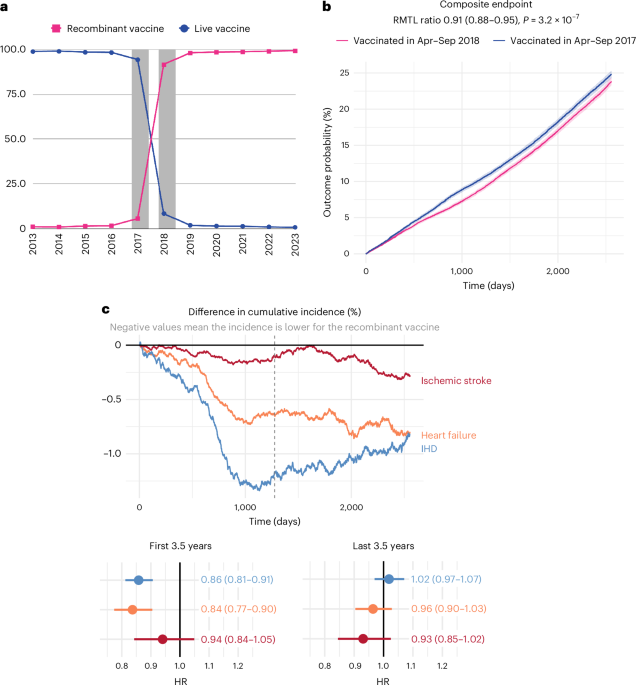
Compliance with the instrument was very high: 98.6% of individuals in the April−September 2017 cohort received the live shingles vaccine, and 93.5% of those in the April−September 2018 cohort received the recombinant shingles vaccine (Fig. 1a). Under intention-to-treat reasoning, this imperfect compliance dilutes the treatment contrast and biases the estimated associations toward the null rather than producing spurious associations20.
Exchangeability (assumption 2)
Although differences in age between cohorts were present before matching, they likely result from gradual drift in the demographics of people receiving the shingles vaccine. Indeed, there has been a gradual increase in the age of people being vaccinated against shingles, and this preceded the transition from the live to the recombinant shingles vaccine.21 This supports the assumption of conditional exchangeability.
After 1:1 propensity score matching, all covariates achieved standardized mean differences ≤0.1 (Supplementary Table 1). The matched cohorts entering the primary analysis are, therefore, well balanced on all observed sociodemographic, comorbidity and medication characteristics, supporting the observed component of conditional exchangeability.
Re-running propensity score matching with baseline covariates captured over different time windows (1, 2, 5 and 10 years before vaccination) yielded an RMTL ratio of 0.94 across all four windows (Table 1). The primary association is, therefore, consistent across the specification of covariate capture, indicating that it is not driven by cumulative state matching that could mask differential pre-vaccination trajectories.
The two cohorts behaved similarly in their preventive healthcare use before vaccination in terms of preventive health indicators. Similarly, the primary cardiovascular composite endpoint itself was null in the year before vaccination (RMTL ratio = 0.99, 95% CI: 0.92−1.06).
Although the above evidence supports exchangeability on observed dimensions, the influence of several unmeasured factors cannot be ruled out. Propensity score matching can only achieve balance of measured covariates, and the analysis of secular trends comparing TDaP vaccine recipients does not establish exchangeability between shingles vaccine cohorts. Socioeconomic status (education, income, occupation, neighborhood deprivation) is not captured in EHR data, and lifestyle factors (smoking, diet, alcohol use) are only indirectly and imperfectly captured through related clinical variables (obesity, diabetes, substance use disorder, etc.). If they systematically differ between cohorts after matching, such unmeasured confounders may violate the exchangeability assumption.
Exclusion restriction (assumption 3)
Comparing TDaP recipients vaccinated in the same calendar windows (April−September 2017 versus April−September 2018) showed no period effect on cardiovascular outcomes (RMTL ratio = 1.01, 95% CI: 0.99−1.03; Table 1). Because TDaP underwent no formulation change between these years, this rules out broad calendar time trends in cardiovascular diagnostic practice and intensity, healthcare delivery or background risk as alternative explanations.
The prespecified composite negative control outcome also supports the exclusion restriction. Because these conditions almost always require healthcare contact but have no suspected link to vaccination, a difference between cohorts would have indicated alternative pathways from vaccination timing to outcomes through generalized differences in diagnostic intensity or healthcare engagement; its null result, therefore, argues against such pathways. Likewise, cohorts were similar in their preventive healthcare use during the follow-up.
Restricting follow-up to before March 2020 yielded the same results. This rules out the possibility that our findings can be solely explained by pandemic-related changes in cardiovascular care seeking, which would have hit the two cohorts at different stages of follow-up because they were vaccinated 1 year apart.
Monotonicity (assumption 4)
A defier in this study would be an individual who would have selected the recombinant shingles vaccine in the April−September 2017 cohort if it had been available but actively refused it in the April−September 2018 cohort. The 6.5% of the April−September 2018 cohort who received the live shingles vaccine despite the recombinant vaccine availability are more likely to be ‘never-takers’ (individuals with a consistent preference for the live vaccine (for example, owing to single-dose preference or lower reactogenicity)) rather than defiers, because the same preferences would have led them to receive the live vaccine in 2017 as well. Defier behavior requires the implausible preference pattern of selecting the recombinant vaccine specifically when it is unavailable but rejecting it once available, for which no realistic clinical or behavioral mechanism exists. Monotonicity is, therefore, plausible by design.
Stable unit treatment value assumption (assumption 5)
Cardiovascular outcomes are individual-level events that do not transmit between people, so vaccinating one individual does not affect another’s cardiovascular risk. Both vaccines are well-defined biological products: the live attenuated vaccine and the recombinant vaccine are both FDA approved with consistent manufacturing during the study period, and no reformulations or sub-versions occurred within the cohort windows.
Cohorts and exposures
Cohorts included all individuals who received their first shingles vaccine dose at the age of 60 or older between 1 April and 30 September 2018 (primary cohort) and between 1 April and 30 September 2017 (comparator cohort).
Participants were excluded if they had a diagnosis of hematological malignancy or immune deficiency recorded on or before their first singles vaccination, as these are relative contraindications for different vaccine types that would break the assumption behind the natural experiment:
Malignant neoplasms of lymphoid, hematopoietic and related tissue (C81−C96)
Monocytic leukemia (C93)
Leukemia of unspecified cell type (C95)
Lymphoid leukemia (C91)
Other unspecified malignant neoplasms of lymphoid, hematopoietic and related tissue (C96)
Myeloid leukemia (C92)
Other leukemia of specified cell type (C94)
Certain disorders involving the immune mechanism (D80−D89)
HIV disease (B20)
For the same reason, we also excluded participants receiving treatments that affect their immune system within 1 year before the first singles vaccination, including:
Immunosuppressants (Anatomical Therapeutic Chemical (ATC) code L04)
Corticosteroids (ATC code R01AD)
Chemotherapy (TriNetX-curated codelist 1002)
Radiation oncology treatment (CPT code 1010843)
Covariates
Evidence from the National Health Interview Survey21 indicates a gradual change in the demographic characteristics of individuals receiving shingles vaccination over time, with increasing coverage among older (≥70 years) compared to younger (60−69 years) adults preceding the transition from live to recombinant vaccines. If unadjusted for, these drifts in the vaccinated population characteristics would affect our effect estimates when comparing people vaccinated in two different calendar periods. Cohorts were, therefore, matched for 83 covariates, including sociodemographic factors, diagnoses, history of herpes infection, history of influenza vaccination and cardiovascular medications. All covariates (with ICD-10 codes for comorbidities) are listed in Supplementary Table 1. Covariates were selected as follows. All available sociodemographic factors were selected. These include age, sex (as recorded in the individual’s EHR), ethnicity, race and marital status. Age is reported as mean and standard deviation but was matched using 2-year bins (60−61, 62−63, …) up to age 95; those 95 and older were grouped together. This provides tighter control on age than using it as a continuous variable.
All broad ICD-10 categories of comorbidities were then included to balance comorbidity profiles between cohorts and because an indirect link with cardiovascular outcomes can be posited for most comorbidity profiles. Some broad ICD-10 categories were further broken down into their most prevalent constituents. This includes ‘Neoplasms’ (ICD-10 codes C00−D49), which was deemed too heterogeneous (because it includes both benign and malignant neoplasms); cardiovascular diseases (I00−I99); psychiatric disorders (F10−F59); and endocrine, nutritional and metabolic disorders (E00−E89), because they were deemed too heterogeneous and because they contain specific risk factors for cardiovascular outcomes, such as overweight and obesity, diabetes and thyroid disorders. In addition, prior herpes infections (both herpes simplex and herpes zoster) were included as covariates. Some factors affecting health and healthcare use (ICD-10 Z codes) were also included when they differed substantially between unmatched cohorts. Finally, to capture proxies of vaccine hesitancy, history of influenza vaccination (recommended every year for all adults in the United States) was included.
Adjustment for these covariates seeks to achieve conditional exchangeability of the cohorts. Notably, it cannot achieve exchangeability if there are unmeasured confounders.
Outcomes
The primary outcome was diagnostic incidence of a composite cardiovascular endpoint comprising ischemic heart disease (ICD-10 codes I20−25), ischemic stroke (ICD-10 code I63) and heart failure (ICD-10 code I50) during a follow-up from 1 day to 7 years after vaccination. These were selected as they were found to be associated with the recombinant shingles vaccine in prior observation studies2,3,4 and are often combined in clinical trials of cardiovascular interventions22.
Because after 1:1 matching both cohorts are restricted to individuals who had a match in the other cohort, the estimand is best interpreted as the average treatment effect in the overlap population, in an intention-to-treat approach where treatment allocation depends on vaccination timing.
Secondary outcomes included atrial fibrillation (ICD-10 code I48); myocarditis (frequently misdiagnosed as ischemic heart disease; ICD-10 codes I09.0, I01.2, I40, I41, I51.4, B33.22 and D86.85); STEMI (ICD-10 codes I21.0−3), which is less likely to be a misdiagnosed myocarditis; peripheral arterial disease (to test for associations with atherosclerosis beyond the heart; ICD-10 codes I74.2 and I74.3); transient ischemic attack (ICD-10 codes G45.0, G45.1, G45.2, G45.3 and G45.9); hemorrhagic stroke (ICD-10 codes I60, I61 and I62); herpes zoster (shingles) infection (ICD-10 code B02); the composite of the primary endpoint or death; and a composite negative control outcome of any acutely painful condition as in our previous study6.
We also report each component of the composite primary endpoint separately. Although one component (for example, heart failure) could be a complication of another (for example, ischemic heart disease) occurring in the same follow-up, this could not be ascertained in the data.
Definition of negative control outcome
Negative control outcomes are not typically associated with the primary outcome of interest and almost invariably require medical attention. We used a negative control composite outcome as defined in a previous publication6, as follows:
Acute pancreatitis (ICD-10 code K85)
Appendicitis (K35)
Acute cholecystitis (K81.0)
Adhesive capsulitis of the shoulder (M75.0)
Trigeminal neuralgia (G50.0)
The negative control outcome was then defined as the composite outcome of a first diagnosis of any of these outcomes.
Statistical analyses
Propensity score matching at a 1:1 ratio with a calliper of 0.1 was used to match cohorts on covariates. Characteristics with a standardized mean difference between cohorts of less than 0.1 were considered well matched23. The propensity score was calculated using a logistic regression (implemented by the function LogisticRegression of the scikit-learn package in Python 3.7) including each of the covariates mentioned above. To eliminate the influence of ordering of records, the record order in the covariate matrix was randomized before matching. The matching itself was performed using numpy 1.21.5 in Python 3.7.
The cumulative incidence of each outcome was estimated using the Kaplan−Meier estimator. Because we anticipated the proportional hazard assumption to be violated with such long follow-ups, differences between cohorts were summarized with the RMTL ratio via the survRM2 package (v.1.0.4)24,25,26. The RMTL ratio represents how much more time, on average, an individual has lived with the outcome during the follow-up period27,28. CIs were estimated using a parametric approach as defined in the survRM2 package in R24.
The E value was calculated to ascertain the sensitivity of the primary outcome to unmeasured confounders (using EValue package v.4.1.4). Given the absence of formulation of the E value for RMTL ratios, we used the E value formula for relative risks given that ratios of cumulative incidence can be interpreted as approximations of RMTL ratios: if the cumulative incidence functions are proportional to each other between cohorts (F1(t) = R × F0(t)), the RMTL ratio is equal to the proportionality constant (R). The E value represents how strongly an unmeasured confounder would need to be associated with both the exposure and the outcome, after adjusting for all measured confounders, to have a chance to explain away the association (that is, in a worst-case scenario where the prevalence of the unmeasured confounder maximizes its bias).
We calculated the difference in cumulative incidence as a function of time of follow-up by subtraction of the Kaplan−Meier curves. In addition, we calculated piecewise constant hazard ratios for the first half (1 day−3.5 years) and the second half (3.5−7 years) of follow-up.
Moderation by sex was tested using a permutation test, with 1,000 permutations as follows. The RMTL ratios between those vaccinated in 2018 and those vaccinated in 2017 were first calculated independently for men and women, and their difference was recorded. In each permutation, individuals were then randomly allocated to two groups of the same size as the initial ‘women’ and ‘men’ groups, and the analysis was repeated within these groups, thus leading to the calculation of RMTL ratios. The difference in absolute value between these RMTL ratios was recorded for each permutation, generating a distribution of 1,000 differences in RMTL ratios under the null hypothesis. The P value for the permutation test was calculated as follows: P = (1 + n>) / (1 + n), where n = 1,000 is the number of permutations and n> is the number of permutations for which the difference in RMTL ratios was greater (in absolute value) than that observed in the non-permuted dataset.
Because we used EHRs with coded health events, if an event was not present it was considered absent. Missing data for sex, race and ethnicity were assigned their own category, which was included in the propensity score matching, so that the matched cohorts had approximately equal numbers of patients with unknown sex, race and ethnicity.
All analyses were performed in R (v.4.4.3) unless otherwise stated. Significance for all tests was set at two-sided P < 0.05.
Secondary analysis
Analyses were repeated after (1) stratification by sex; (2) limiting follow-up to the first 518 days so that it occurred entirely before the COVID-19 pandemic; (3) using narrower ascertainment windows for baseline covariates (1, 2, 5 and 10 years before vaccination) while also adjusting for the number of healthcare encounters during these time windows, to assess whether matching on cumulative state covariates might mask differences in more recent pre-vaccination clinical trajectories; and (4) aligning follow-up times at the cohort level (by trimming follow-up to the shorter follow-up duration between randomly selected pairs of individuals) as in our previous study6 to assess sensitivity to cohort attrition and informative censoring.
To account for competing risks by non-cardiovascular death, we also estimated the cumulative incidence function (CIF) of the composite cardiovascular endpoint using the Aalen−Johansen estimator (cmprsk package v.2.2.12). Equality of CIFs between cohorts was tested with Gray’s non-parametric test (cmprsk package v.2.2.12). Sub-distribution hazard ratios were obtained from a Fine−Gray model29 fitted via the weighted Cox reformulation of Geskus with cluster-robust variance (‘survival’ package v.3.8.6); the proportional hazards assumption was assessed using scaled Schoenfeld residuals (‘survival’ package v.3.8.6), and, when violated, we fitted a time-segmented Fine−Gray model across four follow-up windows (0−1, 1−3, 3−5 and 5−7 years). For consistency with the primary analysis, we also report the Aalen−Johansen-based restricted mean time lost (AJ-RMTL) ratio by direct integration of the Aalen−Johansen CIF curves.
To assess potential secular trends in cardiovascular event incidence, such as changes in diagnostic practices or prevention over time, we compared the risk of the primary outcome among individuals who received a TDaP vaccine between April and September 2017 with those vaccinated during the same months in 2018. TDaP was selected because it is recommended for adults at 10-year intervals, unlike influenza vaccination, which is recommended annually. This comparison is subject to the same underlying secular trends as our primary analysis but does not involve the shingles vaccine transition. The TDaP cohorts were approximately 10 times larger than those in the primary analysis, providing substantially greater statistical power to detect any influence of temporal trends on the outcome. Besides the differences in cohort definitions, this analysis was otherwise conducted exactly as the primary analysis.
To assess whether people vaccinated against shingles in April−September 2018 had similar preventive healthcare use before vaccination as those vaccinated in April−September 2017, we compared preventive health indicators in the year before vaccination. We restricted the primary cohorts to individuals with a healthcare encounter 1−2 years before vaccination—that is, between April 2015 and March 2016 for those vaccinated in April−September 2017 and between April 2016 and March 2017 for those vaccinated in April−September 2018. We then rematched the cohorts on the same covariates as above but measured only before this earlier healthcare encounter, to avoid matching on healthcare use during the year immediately preceding vaccination.
We examined several indicators of preventive healthcare use, including influenza and pneumococcal vaccination; prescriptions for statins, antihypertensives and antidiabetics; and breast and bowel cancer screening. However, some of these may vary across calendar periods for reasons unrelated to shingles vaccination timing, limiting their value for this comparison. To identify indicators unaffected by such secular trends, we applied the same approach as above, comparing their frequency in the year before TDaP vaccination received in April−September 2018 versus April−September 2017. Only influenza and pneumococcal vaccination showed no systematic difference between the two periods, so we used these as indicators, together with a general code for preventive medicine services (CPT codes 1013829 and 1013859). Using the same approach, we also compared the risk of the primary cardiovascular endpoint in the year before shingles vaccination between the 2017 and 2018 cohorts to assess whether they were on similar cardiovascular health trajectories before vaccination.
Similarly, we assessed preventive healthcare use between cohorts during the follow-up. We considered the same preventive healthcare indicators as above and selected those that showed no secular trends (as detected by comparing cohorts who received TDaP vaccines). This led to the selection of bowel cancer screening (ICD-10-CM Z12.11) and antihypertensive prescription (VA CV100 or CV200 or CV800 or CV701 or CV805), together with a general code for preventive medicine services (CPT codes 1013829 and 1013859).
We also compared the recombinant shingles vaccine with two additional vaccines (namely, TDaP and influenza) given in April−September 2018.
Reporting summary
Further information on research design is available in the Nature Portfolio Reporting Summary linked to this article.



