
Retrospective, real-world patient data
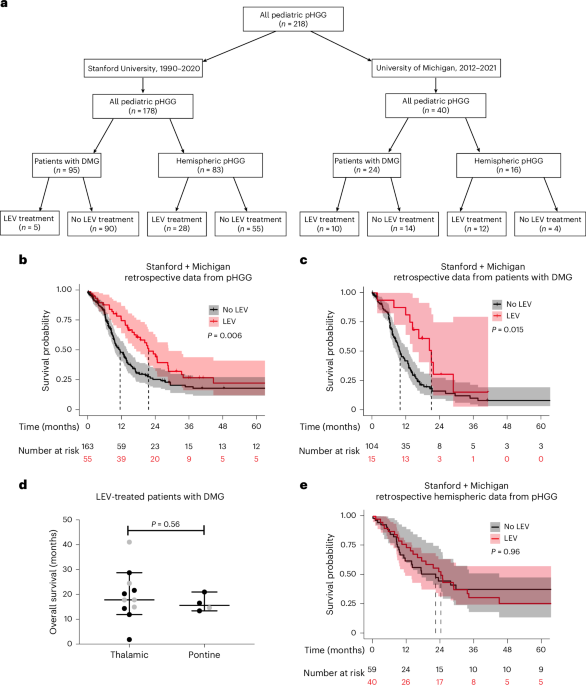
Retrospective data on patients with high-grade glial tumors were collected from patient databases at Stanford University (1990–2020) and the University of Michigan (2012–2021) through protocols approved by the respective institutional review boards (IRB). Database source data for pediatric patients with HGG were reviewed for this study to ensure veracity and completeness. For patients with tissue samples available (22 cases from Stanford University and University of Michigan), central review by a board-certified neuropathologist (H.V.) confirmed diagnoses. OS was calculated using the Kaplan–Meier estimator; the log-rank test was utilized to compare survival distributions. Patients were censored at time of last contact for the Kaplan–Meier analysis. Given the number of potential parameters with high correlation, an elastic net-regularized regression was utilized for covariate selection in a multivariable survival model. Clinical data including age, sex, tumor location, diagnosis of DMG and administration of ONC201, panobinostat, conventional chemotherapy and levetiracetam were considered potential covariates. A 20-fold cross-validation was used to obtain the value of λ that gave the minimum mean cross-validated error; corresponding coefficients for each variable were subsequently determined. All data were compiled and analyzed in R version 4.0 or higher. External validation cohorts for both entities, H3K27M DMG and pediatric hemispheric HGGs, were established from the University Medical Center Hamburg-Eppendorf (Germany), collected from patient records between 2006 and 2021. An additional validation cohort of patients with DMG was provided from the UCSF, collected from patient records between 2012 and 2022. Validation cohort data were analyzed using Prism v9.1.0 (GraphPad) software.
Human samples and data
For all human tissue and cell studies, informed consent was obtained and tissue was used in accordance with protocols approved by the Stanford University IRB. IRB approval was also obtained for retrospective analyses of real-world clinical data kept in IRB-approved databases at Stanford University, University Michigan and UCSF. For the cohort from University Medical Center Hamburg-Eppendorf, informed written consent was obtained from all patients or their legal guardians, and further data processing was approved by the medical ethics committee of the Hamburg Chamber of Physicians (PV4904).
Mice and housing conditions
All in vivo experiments were conducted in accordance with protocols approved by the Stanford University Institutional Animal Care and Use Committee (IACUC) and performed in accordance with institutional guidelines. Animals were housed according to standard guidelines at 21 °C with free access to food and water in a 12 h light–12 h dark cycle. For brain tumor xenograft experiments, the IACUC does not set a limit on maximal tumor volume but rather on indications of morbidity. In no experiments were these limits exceeded as mice were killed if they exhibited signs of neurological morbidity or if they lost 15% or more of their body weight.
Orthotopic xenografting and allografting
For all patient-derived xenograft studies, NSG mice (NOD-SCID-IL2R gamma chain-deficient, The Jackson Laboratory) were used. For allograft studies, C57BL/6J mice (The Jackson Laboratory) were used. Male and female mice were used equally. A single-cell suspension from cultured SU-DIPG-VI, SU-DIPG-XIII-FL, SU-DIPG-50, SU-pcGBM2, SU-DIPG-36, SU-DIPG-XIII-P, SF0232 or SF0238 patient-derived glioma neurospheres8,16 or cultured cells derived from an electroporation-induced genetic mouse model of H3K27M DMGs (MADR24,34) were prepared in sterile phosphate-buffered saline (PBS) immediately before the xenograft or allograft procedure. All DMG models express GFP except SU-DIPG-XIII-P (pons). Animals at postnatal day (P)28–30 were anaesthetized with 1–4% isoflurane and placed in a stereotactic apparatus. The cranium was exposed via midline incision under aseptic conditions. Approximately 300,000 cells in 3 µl sterile PBS were stereotactically implanted through a 26G burr hole, using a digital pump at infusion rate of 0.4 µl min−1 and 26G Hamilton syringe. For all electrophysiology and optogenetics experiments, cells were implanted into the CA1 region of the hippocampus (1.5 mm lateral to midline, −1.8 mm posterior to bregma, −1.4 mm deep to cranial surface). SU-DIPG-XIII-FL, SU-pcGBM2, SF0232 and SF0238 for levetiracetam treatments were xenografted into the premotor cortex (0.5 mm lateral to midline, 1.0 mm anterior to bregma, −1.75 mm deep to cranial surface). SU-DIPG-XIII-P and SU-DIPG-36 for survival studies and SU-DIPG-VI, SU-DIPG-50 and MADR for levetiracetam, ethosuximide, phenytoin and perampanel treatments were xenografted or allografted into the pons (1.0 mm lateral to midline, −0.8 mm posterior to lambda, −5.0 mm deep to cranial surface). At the completion of infusion, the syringe needle was allowed to remain in place for a minimum of 2 min and then manually withdrawn at a rate of 0.875 mm min−1 to minimize backflow of the injected cell suspension.
Patient-derived and mouse model-derived cell culture
HGG cultures SU-DIPG-VI, SU-DIPG-XIII-FL, SU-DIPG-50, SU-pcGBM2, SU-DIPG-36 and SU-DIPG-XIII-P were generated from patient tissue samples as previously described2,3. In brief, tissue was obtained from HGG (World Health Organization grade 3 or 4) tumors at the time of biopsy or from early post-mortem donations in accordance with IRB-approved protocols. Tissue was dissociated both mechanically and enzymatically and grown in a defined, serum-free medium designated ‘tumor stem media’, consisting of neurobasal(-A) (Invitrogen), B27(-A) (Invitrogen), human bFGF (20 ng ml−1, Shenandoah), human EGF (20 ng ml−1, Shenandoah), human PDGF-AA (10 ng ml−1) and PDGF-BB (10 ng ml−1, Shenandoah) and heparin (2 μg ml−1, Stem Cell Technologies). For all patient-derived cultures, mycoplasma testing was routinely performed, and short tandem repeat DNA fingerprinting was performed every 3 months to verify authenticity. The short tandem repeat fingerprints and clinical characteristics for the patient-derived cultures and xenograft models used have been previously reported2,3 Patient-derived HGG cells SF0232 and SF0238 were a generous gift from Shawn Hervey-Jumper at UCSF. For the murine MADR DMG model cells, culture was performed similarly as previously described24,34.
Mouse drug treatment studies
For histological analysis of tumor proliferation and tumor burden in patient-derived xenografts, NSG mice were xenografted as above with SU-DIPG-VI, SU-DIPG-XIII-FL, SU-DIPG-50, SU-pcGBM2, SF0232 or SF0238 cells and randomized to treatment group by a blinded investigator. A total of 4–6 weeks postxenograft, mice were treated with systemic administration of levetiracetam (20 mg kg−1, Selleck Chemicals) or phenytoin (50 mg kg−1, Selleck Chemicals) via intraperitoneal injection or ethosuximide (300 mg kg−1, Selleck Chemicals) or perampanel (0.75 mg kg−1, Adooq Biosciences) via oral gavage for 4 weeks (once a day administration, 5 days per week).
For the MADR murine DMG model, C57BL/6J mice were allografted as above and randomized to treatment group by a blinded investigator. A total of 10 days after allografting, mice were treated with systemic administration of levetiracetam (20 mg kg−1, Selleck Chemicals) via intraperitoneal injection for 4 weeks (5 days per week).
For all studies, controls were treated with an identical volume of the relevant vehicle. Bioluminescence imaging was performed before treatment and every 7 days thereafter using an IVIS imaging system (Xenogen) under isoflurane anesthesia.
For survival studies, SU-DIPG-36 or SU-DIPG-XIII-P cells were xenografted to pons as above, and levetiracetam was administered (20 mg kg−1 intraperitoneal injection), beginning 3 days after xenografting and administered 5 days a week for 28 days. Morbidity criteria used were either reduction of weight by 15% initial weight or severe neurological motor deficits consistent with brainstem dysfunction (that is, hemiplegia or an incessant stereotyped circling behavior seen with ventral midbrain dysfunction). Kaplan–Meier survival analysis using log-rank testing was performed to determine statistical significance.
Perfusion and immunohistochemistry
Animals were anaesthetized with intraperitoneal avertin (tribromoethanol) and then transcardially perfused with 20 ml of PBS. Brains were fixed in 4% PFA overnight at 4 °C and then transferred to 30% sucrose for cryoprotection. Brains were then embedded in Tissue-Tek OCT (Sakura) and sectioned in the coronal plane at 40 µm using a sliding microtome (Microm HM450, Thermo Scientific).
For immunohistochemistry, coronal sections were incubated in blocking solution (3% normal donkey serum, 0.3% Triton X-100 in TBS) at room temperature for 1–2 h. Chicken anti-GFP (1:500, Abcam), mouse antihuman nuclei clone 235-1 (1:100, Millipore) and rabbit anti-Ki67 (1:500, Abcam) were diluted in antibody diluent solution (1% normal donkey serum in 0.3% Triton X-100 in TBS) and incubated 24–36 h at 4 °C. Sections were then rinsed three times in TBS and incubated in secondary antibody solution containing Alexa 488 donkey antichicken IgG, Alexa 594 donkey antimouse IgG, Alexa 594 donkey antirabbit IgG, Alexa 647 donkey antimouse IgG or Alexa 647 donkey antirabbit IgG, used at 1:500 (Jackson ImmunoResearch) in antibody diluent at 4 °C for 2 h. Sections were rinsed three times in TBS and mounted with ProLong Gold Mounting medium (Life Technologies).
Confocal imaging
Images were acquired using a 40× oil immersion objective or 20× air objective of a Zeiss LSM700, Zeiss LSM800 or Zeiss LSM980 scanning confocal microscope and Zen imaging software (Carl Zeiss). Cell quantification within xenografts was performed by a blinded investigator.
Quantification of cell proliferation, tumor burden and tumor spread
For Ki67 analysis, three fields for quantification were selected from each of three consecutive sections in a 1-in-6 series of 40-μm coronal sections with respect to overall tumor burden. Within each field, all HNA-positive and GFP-positive tumor cells were quantified to determine tumor burden within the areas quantified. HNA-positive cells were then assessed for co-labeling with Ki67. To calculate the proliferation index (the percentage of proliferating tumor cells for each mouse), the total number of HNA-positive cells co-labeled with Ki67 across all areas quantified was divided by the total number of cells counted across all areas quantified (Ki67+/HNA+). For analysis of tumor burden and tumor spread, all slices containing tumor cells were imaged from a 1-in-2 series of 40-μm coronal sections. Images of whole brain slices were adjusted for threshold and analyzed in ImageJ. In brief, a polygon section containing the tumor cells was traced and measured for area (for tumor spread) and mean intensity (for tumor burden).
EdU incorporation assay
DIPG tumor neurosphere cultures SU-DIPG-VI, SU-DIPG-XIII and SU-DIPG-50 were generated as previously described2,3 from early post-mortem tissue donations and grown as tumor neurospheres in defined, serum-free ‘tumor stem medium’, consisting of 1:1 mixture of neurobasal(-A) (Invitrogen) and D-MEM/F-12 (Invitrogen), HEPES buffer (Invitrogen), MEM sodium pyruvate (Invitrogen), MEM non-essential amino acids (Invitrogen), GlutaMAX-1 supplement (Invitrogen), B27(-A) (Invitrogen), human bFGF (20 ng ml−1, Shenandoah), human EGF (20 ng ml−1, Shenandoah), human PDGF-AA (10 ng ml−1) and PDGF-BB (10 ng ml−1, Shenandoah) and (2 μg ml−1, Stem Cell Technologies).
A total of 100,000 glioma cells were plated onto circular glass coverslips (Electron Microscopy Services) pretreated for 1 h at 37 °C with poly-ʟ-lysine (Sigma) and then 1 h at 37 °C with 10 µg ml−1 natural mouse laminin (Thermo Fisher). Dimethyl sulfoxide (Sigma-Aldrich) or drugs at the concentrations indicated (dissolved in dimethyl sulfoxide) were added to the coverslips. A total of 10 μM EdU was added to each coverslip. Cells were fixed after 24 h using 4% paraformaldehyde in PBS and stained using the Click-iT EdU kit and protocol (Invitrogen). Proliferation index was then determined by quantifying the fraction of EdU labeled cells/DAPI-labeled cells using confocal microscopy.
Slice preparation for electrophysiology
Coronal slices (300-µm thick) containing the hippocampal region were prepared from mice (at least 8 weeks after xenografting) in accordance with a protocol approved by Stanford University IACUC. After rapid decapitation, the brain was removed from the skull and immersed in ice-cold slicing artificial cerebrospinal fluid (ACSF) containing: 125 mM NaCl, 2.5 mM KCl, 25 mM glucose, 25 mM NaHCO3 and 1.25 mM NaH2PO4, 3 mM MgCl2 and 0.1 mM CaCl2. After cutting, slices were incubated for 30 min in warm (30 °C) oxygenated (95% O2, 5% CO2) recovery ACSF containing: 100 mM NaCl, 2.5 mM KCl, 25 mM glucose, 25 mM NaHCO3, 1.25 mM NaH2PO4, 30 mM sucrose, 2 mM MgCl2 and 1 mM CaCl2 before being allowed to equilibrate at room temperature for an additional 30 min.
Electrophysiology
Slices were transferred to a recording chamber and perfused with oxygenated, warmed (28–30 °C) recording ACSF containing: 125 mM NaCl, 2.5 mM KCl, 25 mM glucose, 25 mM NaHCO3, 1.25 mM NaH2PO4, 1 mM MgCl2 and 2 mM CaCl2. Cells were visualized using a microscope equipped with DIC optics (Olympus BX51WI). For glioma cell recordings and neuronal inhibitory postsynaptic current recordings, patch pipettes were filled with CsCl-based pipette solution containing: 150 mM CsCl, 5 mM EGTA, 1 mM MgCl2, 10 mM HEPES, 2 mM ATP, 0.3 mM GTP, pH 7.3. For neuronal excitatory postsynaptic currents recordings, patch pipettes were filled with K-gluconate-based pipette solution containing: 20 mM KCl, 100 mM K-gluconate, 10 mM HEPES, 4 mM Mg-ATP, 0.3 mM Na-GTP, 10 mM Na-phosphocreatine, 0.2 mM EGTA, pH 7.3. Patch electrodes had resistances of 4–5 MΩ. Pipette solution additionally contained Alexa 568 (50 μM) to visualize the cell through dye-filling during whole-cell recordings. Gramicidin A (60 μg ml−1) was added to the pipette solution for perforated patch recordings. A perforated patch was considered satisfactory when an access resistance of ~30 MΩ was obtained about 30 min after attaining gigaseal resistance. Leak of Alexa 568 dye from the pipette into the cell during perforated patch recordings indicates a damaged membrane, and the data from such recordings were discarded. EGABA was calculated for each individual cell and averaged. Glioma cells were voltage-clamped at a holding potential of −70 mV. For all experiments, series resistance was <30 MΩ. Synaptic responses in gliomas and neurons were evoked with a bipolar electrode connected to an Iso-flex stimulus isolator (AMPI) placed 100–200 μm from the patched cells to stimulate local interneurons or Schaffer collaterals. A low intensity stimulation, sufficient to evoke consistent responses but not higher, was used at a frequency of 0.1 Hz throughout the experiment, including 10 min of baseline recordings and 30 min of levetiracetam or brivaracetam perfusion. For EGABA recordings, GABA (1 mM) in recording ACSF was applied via a puff pipette, which was placed approximately 100 μm away from the patched cell and controlled by a Picospritzer II (Parker Hannifin Corp.), and tetrodotoxin (0.5 µM) was perfused with the recording ACSF to prevent neuronal action potential firing. Signals were acquired with a MultiClamp 700B amplifier (Molecular Devices) and digitized at 10 kHz with an Axon Digidata 1550B (Molecular Devices) or an InstruTECH LIH 8 + 8 data acquisition device (HEKA). Data were recorded and analyzed using pClamp 11 software suite (Molecular Devices), AxoGraph X (AxoGraph Scientific) and/or IGOR Pro 8 (Wavemetrics). For representative traces, stimulus artifacts preceding the synaptic responses have been removed for clarity.
Pharmacological agents
Drugs and toxins used for electrophysiology were picrotoxin (50 µM, Tocris), NBQX (10 µM, Tocris), D-AP5 (100 µM, Tocris), tetrodotoxin (0.5 µM, Tocris), levetiracetam (100 μM, Selleck Chemicals) and brivaracetam (30 μM, UCB). When used for in vitro slice application, drugs were made up as a stock in distilled water or dimethyl sulfoxide and dissolved to their final concentrations in ACSF before exposure to slices. Final concentration of dimethyl sulfoxide was <1%.
SV2A knockdown in human iPS cell-derived GABAergic neurons
Human iPS cell-derived GABAergic neurons (Bit.bio io1003) were used for neuron–glioma co-culture assays. 96-well µ-plates (ibidi 89607) were coated overnight at room temperature with 0.01% poly-L-ornithine (Sigma-Aldrich P4957), washed 3× with sterile water and subsequently coated for 2 h at 37 °C with laminin (R&D Systems 3400-010-02) diluted in sterile PBS. Cells were seeded immediately after laminin removal at 3 × 10⁴ cells per well in 100 µl comp:GS medium (DMEM/F-12, N2 (1×), MEM NEAA (1×) and doxycycline (1 µg ml−1)). Cryovials were thawed at 37 °C, diluted dropwise with DMEM/F-12 (Thermo Fisher 11330032) and centrifuged at 200g for 5 min at room temperature. Cell pellets were resuspended in comp:GS + R stabilization medium (comp:GS supplemented with 10 µM ROCK inhibitor Y-27632; Abcam Ab144494) and cultured for 72 h. At 24 h post thaw (day 3), 90% of the medium was replaced with comp:GS. After 72 h, media were switched to maintenance medium (comp:MM: Neurobasal supplemented with B27 (1×), GlutaMAX (1×) and BDNF (10 ng ml−1)). Half-media changes were performed every 48 h.
For SV2A knockdown, neurons were transduced 72 h after thawing using human shRNA lentiviral particles (OriGene TL308996V) or scrambled control. Viral particles were mixed with lentiviral transduction enhancer (System Biosciences LV860A-1) according to the manufacturer’s instructions and applied to cells for 48 h, followed by a full medium replacement with comp:MM. Efficient SV2A knockdown was validated by immunofluorescence.
A total of 14 days after cell induction, glioma cells (SU-DIPG-VI-GFP, 1.5 × 10⁴ cells per well) were added to neuronal cultures and co-incubated for 48 h in comp:MM. Subsequently, 4 µM 5-ethynyl-2′-deoxyuridine (EdU) was added with or without levetiracetam and incubated for an additional 24 h. Cultures were fixed with 4% paraformaldehyde for 20 min at room temperature. EdU staining was performed using the manufacturer’s protocol (Click-iT EdU Imaging Kit, Thermo Fisher C10339). Cells were stained overnight at 4 °C with chicken antineurofilament-H/M (1:500, Antibodies Incorporated AB_2313554) and rabbit anti-SV2A (1:500, Synaptic Systems 119 003). After washing, cells were incubated for 2 h at room temperature with species-matched Alexa Fluor secondary antibodies (1:500, Jackson ImmunoResearch 703-605-155 and 711-585-152). Wells were mounted with antifade medium (ProLong Gold, Thermo Fisher P36930) and imaged using a Zeiss LSM980 confocal microscope. SV2A knockdown was quantified by mean fluorescence intensity of SV2A staining. Proliferation index was determined by quantifying the fraction of EdU labeled cells/GFP labeled cells.
Statistical analyses
Statistical tests were conducted using Prism v9.1.0 (GraphPad) software. Gaussian distribution was confirmed by the Shapiro–Wilk normality test. For parametric data, unpaired two-tailed Student’s t-test or one-way analysis of variance (ANOVA) with Tukey’s or Dunnett’s post hoc test to examine pairwise differences and/or test for linear contrast were used as indicated in figure legends. Paired two-tailed Student’s t-tests or repeated measures one-way ANOVA with Dunnett’s post hoc analysis were used in electrophysiological experiments within the same cell. Simple linear regression analysis was used to determine the x intercept in current–voltage relationship experiments. Two-tailed log-rank analyses or Gehan–Breslow–Wilcoxon analyses were used to analyze statistical significance of Kaplan–Meier survival curves. Statistical test results are reported in Figs. 1–5 and Extended Data Figs. 1 and 2. At least three mice for in vivo experiments, and at least three independent coverslips for in vitro experiments, were used per test group to attain 80% power to detect an effect size of 20% at significance level 0.05. Statistical analyses of retrospective patient data are described above.
Reporting summary
Further information on research design is available in the Nature Portfolio Reporting Summary linked to this article.



