
Ethical approval and consent
The study was conducted in accordance with the Declaration of Helsinki, the International Council for Harmonisation Good Clinical Practice guidelines and applicable national regulations from the recruiting country (Spain) and the European Union. The study protocol was approved by the Ethics Committee of Arnau de Vilanova Hospital (Valencia, Spain). All participants provided written informed consent before undergoing any study-specific procedures. The ethics committee of Arnau de Vilanova Hospital approved the study. Written informed consent was obtained from each patient. The trial is registered at ClinicalTrials.gov (NCT04332744) and the European Union Clinical Trials Register (EU CT 2023-509387-24-00).
Study oversight
ZZ-FIRST is an investigator-initiated study sponsored by the Medica Scientia Innovation Research (MEDSIR). The trial was designed by the chief investigator with input from the sponsor and participating investigators. The trial was overseen by a steering committee formed by the chief investigator (J.M.), a site principal investigator (E.C.) and two additional expert investigators (J.C. and A.J.Z.), together with sponsor personnel. Pfizer provided external funding for the study; Pfizer and Astellas Pharma supplied trial medications. Personnel from the participating sites transcribed the data from source documents into electronic case report forms.
Study design and participants
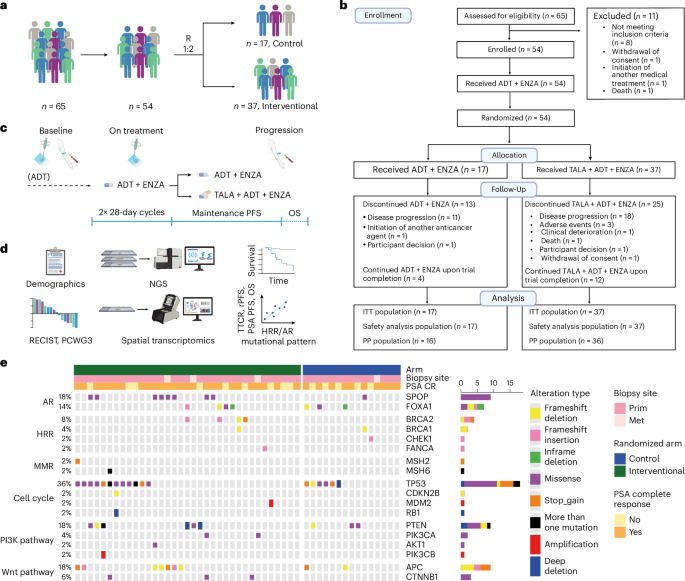
ZZ-FIRST is a multicenter, open-label, randomized, two-arm, investigator-initiated phase 2 clinical trial conducted across eight sites in Spain. The trial protocol is available in the Supplementary Information. The study aimed to evaluate the activity and safety of talazoparib in combination with enzalutamide and ADT in patients with high-volume mHNPC.
Key inclusion criteria were as follows: age ≥18 years, high-volume metastatic PCa documented on bone scan or computed tomography/magnetic resonance imaging (MRI), defined as the presence of either visceral disease and/or at least four bone metastases on bone scan, with at least one of them beyond spine/pelvis7; histologically documented prostate adenocarcinoma without predominance of small-cell or NE features; ECOG PS 0-1; life expectancy of ≥12 months; and PSA ≥4 ng ml−1 at diagnosis (before starting ADT therapy). Key exclusion criteria were as follows: prior treatment with enzalutamide, apalutamide, darolutamide or abiraterone acetate; any prior systemic therapy for metastatic PCa (patients could have initiated ADT up to 28 days before enrollment, providing a tumor biopsy had been collected before ADT start); known or suspected brain metastases or active leptomeningeal disease; therapeutic radiation therapy within 14 days (7 days for limited-field palliative radiotherapy) before treatment initiation; and clinically relevant cardiovascular disease. The study enrolled patients with histologically confirmed PCa; therefore, all participants were male based on biological sex; gender identity was not collected. A detailed list of all inclusion and exclusion criteria is available in the Clinical Study Protocol (CSP), which is available as Supplementary Information, including a list of protocol amendments during the course of the study.
Study procedures
All participants initiated enzalutamide (160 mg once daily) plus ADT (selected by the investigators) at study entry. After two 28-day cycles, patients were randomized 1:2 to continue enzalutamide plus ADT or to receive talazoparib (0.5 mg once daily) plus enzalutamide plus ADT. This design allowed collection of on-treatment biopsies after approximately 4 weeks of AR pathway inhibition and before exposure to talazoparib.
ADT was maintained throughout study participation in both arms. Randomization was stratified based on the HRR mutational status (present versus absent/unknown), determined through prospective central NGS testing of the baseline tumor tissue biopsy. Treatment continued until disease progression, unacceptable toxicity, death, withdrawal of consent or investigator decision. In the interventional arm, if one study drug was permanently discontinued, the remaining agent(s) could be continued as per local investigator’s criteria. Dose modifications for enzalutamide and talazoparib were permitted according to the protocol-defined guidelines.
Radiological assessments included computed tomography or MRI of the chest, abdomen and pelvis, and bone scintigraphy for all patients at baseline. Imaging was repeated every 8 weeks for the first 24 weeks and every 12 weeks thereafter. Tumor response was assessed according to RECIST (v1.1) for soft tissue disease and PCWG3 criteria for bone disease. Serum PSA levels were measured at baseline, every 4 weeks during the first 12 months, and every 8 weeks thereafter.
Overall response at each radiological assessment was determined for the definition of the efficacy endpoints, according to RECIST (v1.1) criteria. PCWG3 criteria helped to estimate rPFS, time to clinical progression (TCP), PSA progression of disease and time to development of castration resistance (TTCR). RECIST (v1.1) criteria helped to estimate rPFS, TCP and TTCR. Imaging assessments were continued until radiographic progression, initiation of new anticancer therapy, withdrawal of consent, death or end of study.
Tumor biopsies were obtained at baseline and on treatment (after approximately 1 month of enzalutamide treatment on trial) according to the study protocol. A prostate MRI after one cycle of treatment was recommended to guide on-treatment biopsy collection, although it was not used for response evaluation. When feasible, the same lesion was biopsied at baseline and on treatment. Rebiopsy upon progression was optional. All baseline biopsies were acquired before starting study treatment and, if possible, before starting ADT. Four cases had baseline biopsies collected after starting ADT (range = 3–16 days after first ADT prescription, with testosterone still in noncastrate levels).
NGS to stratify randomization based on HRR gene alterations
Baseline HRR gene alteration status was determined using tumor tissue obtained from either archival samples or newly collected baseline biopsies. DNA was extracted from FFPE tissue sections. Targeted NGS was performed at the Vall d’Hebron Institute of Oncology (VHIO) Cancer Genomics Core Technology laboratory using the ISO-accredited VHIO-300 hybrid capture-based panel35. Library preparation was performed using Agilent SureSelect XT chemistry (Agilent Technologies), followed by paired-end sequencing (2 × 100 bp) on an Illumina HiSeq 2500 platform to a minimum depth of 500×. Sequencing reads were aligned to the GRCh37 (hg19) reference genome using BWA-MEM (v0.7.17). Base quality recalibration and indel realignment were performed using GATK (v3.7.0) and ABRA2 (v2.23). Somatic variant calling was conducted using VarScan 2 (v2.4.3) and Mutect2 (GATK; v4.1.0.0). Variants were retained if detected by both callers, supported by ≥7 reads, and with a VAF of ≥5% for single nucleotide variants and ≥10% for insertions and deletions. Variant annotation was performed using COSMIC, ClinVar, VarSome and OncoKB, followed by manual curation. Copy number alterations were inferred using CNVkit (v0.9.6) and annotated as previously described.
For stratification at randomization, HRR gene status was defined based on the presence of pathogenic or likely pathogenic alterations in a predefined set of HRR-related genes based on a review of prior clinical trials in the field (ATM, ATR, BARD1, BRCA1, BRCA2, BRIP1, CDK12, CHEK1, CHEK2, FANCA, PALB2, RAD50, RAD51). Samples in which sequencing was unsuccessful were classified as having unknown HRR status and merged with the WT category for randomization. Efficacy analyses by genomic subgroups were performed in the population with evaluable samples (50/54 (92.6%) patients).
Endpoints
The primary endpoint was the proportion of patients achieving a PSA value <0.2 ng ml−1 at month 12 of therapy (PSA < 0.2 RR, also labeled as PSA-CR in the statistical analysis plan (SAP)). The null hypothesis assumed a PSA < 0.2 rate of ≤20%, and the alternative hypothesis assumed a rate of ≥40% based on the available evidence for high-volume mHNPC at the time of study design. A second confirmed PSA reading at least 4 weeks apart was required.
Secondary endpoints included PSA <0.2 RR at 7 months and at any time during treatment; proportion of patients with PSA nadir <4 ng ml−1 at 7 and 12 months; PSA-PFS according to PCWG3 criteria (defined as a ≥25% increase and an absolute increase of ≥2 ng ml−1 from the nadir, confirmed by a second measurement ≥3 weeks later); rPFS assessed per RECIST (v1.1) for soft tissue disease and PCWG3 criteria for bone disease; TCP; TTCR, defined based on PSA and/or radiographic progression and/or unequivocal clinical progression based on investigator’s criteria that leads to a change in treatment; and OS.
Safety endpoints included the incidence and severity of AEs, including prespecified AEs of special interest, graded according to the National Cancer Institute Common Terminology Criteria for Adverse Events (v5.0), as well as changes from baseline in selected laboratory parameters and vital signs.
All time-to-event endpoints were defined from the time of randomization unless otherwise specified. Sensitivity analyses were performed using time from first administration of study treatment. Detailed definitions of all endpoints are provided in the Supplementary Table 10.
Cases missing genomics profiling (n = 4) were excluded from the exploratory genomic subgroup analysis.
Statistical analysis
All statistical analyses were conducted according to a prespecified SAP, without deviations. Efficacy analyses were primarily performed in the intention-to-treat population, defined as all randomized patients who received at least one dose of study treatment. Sensitivity analyses were conducted in the per-protocol population, which included patients who met all protocol-defined requirements. Safety analyses were performed in the safety population, which was identical to the intention-to-treat population.
All statistical tests were two sided, with a significance level of α = 0.05, unless otherwise specified. Given the exploratory nature of this phase 2 study, no adjustment for multiple comparisons was performed, and P values are reported for descriptive purposes. Estimands were defined in accordance with ICH E9 (R1) guidelines and are detailed in the SAP, which is available in Supplementary Information.
The primary analysis evaluated whether the PSA <0.2 RR at 12 months in the interventional arm exceeded a predefined threshold using an exact binomial test. The null hypothesis assumed a PSA-CR rate of ≤20%, and the alternative hypothesis assumed a rate ≥40%. Participants who would not have on-study PSA re-evaluation, who received antitumor treatment other than the study medication or who died, progressed or dropped out for any reason before reaching the response criterion were counted as nonresponders in the assessment of the primary endpoint.
Based on the assumptions of H0 = 20% and H1 = 40%, observing at least 11 PSA-CR events among 32 evaluable patients would support further clinical investigation. Enrollment of 36 patients in the interventional arm was estimated to provide 80% power at a one-sided α level of 0.05. Comparisons between the interventional triplet arm and the doublet control arm were prespecified as exploratory and were not part of the primary efficacy assessment. With a planned 2:1 randomization, 54 patients were expected to be enrolled overall. Randomization was performed by the study biostatistician (SAIL S.L.) using a covariate-adaptive minimization algorithm49, implemented through the MINIRAND package in R50. The minimization used the range method to calculate treatment arm imbalance, with a target probability of 0.9 for assignment to the minimizing arm, incorporating a random component to prevent deterministic allocation. Patients were randomized in a 1:2 ratio (control:interventional), with assignments balanced between two stratification factors with equal weights—study site and HRR gene alteration status (presence versus absence/unknown). Allocation concealment was ensured through a central, interactive web-based electronic case report form—treatment arm assignment was generated dynamically and revealed to site personnel only upon confirmation of patient eligibility within the system, preventing foreknowledge of subsequent allocations. The randomization sequence and assignment database were maintained in a secure, centralized system accessible exclusively to the SAIL S.L. biostatistician, with full audit trails. Enrolling site investigators did not have access to the randomization sequence and received treatment allocation only at the time of each individual patient’s randomization.
PSA <0.2 RR and PSA <4 RR at 7 and 12 months, respectively, were summarized with exact Clopper–Pearson 95% CI. The primary endpoint was tested using an exact binomial test. An exploratory comparison across treatment arms was performed using Fisher’s exact test.
Time-to-event endpoints, including PSA-PFS, rPFS, TCP, TTCR and OS, were estimated using the Kaplan–Meier method. Median survival times and corresponding 95% CIs were calculated using the Brookmeyer–Crowley method with log–log transformation. When comparing secondary endpoints across treatment arms, adjusted HRs and P values are presented, considering the impact of HRR mutational status, which was the stratification factor for randomization.
Relative dose intensity was calculated for each study drug from randomization to treatment discontinuation as the ratio of the actual administered dose to the planned protocol dose.
All statistical analyses were performed using SAS (v9.4, TS1M8) and R (v4.4.1 or later). Additional details are provided in the SAP.
CH mutations analyses
For CHIP variant analyses, we analyzed buffy coat (BC) samples collected at baseline and, when available, at disease progression. BC fractions containing peripheral blood leukocytes were isolated from whole blood by centrifugation upon collection, to be then aliquoted and stored at −80 °C until processing. Genomic DNA was extracted from frozen BC samples using a standardized protocol adapted from the AllPrep DNA/RNA/miRNA kit (Qiagen). DNA quantity was assessed using the Qubit double-stranded DNA broad-range assay (Thermo Fisher Scientific), and DNA integrity was evaluated using the Genomic DNA ScreenTape system (Agilent Technologies). Whole-exome-sequencing libraries were prepared from 100 ng of genomic DNA using the KAPA EvoPlus V2 kit (Roche) with unique molecular identifiers (UMIs) and dual indexing. Libraries were pooled and captured using KAPA HyperExome V2 probes (Roche), followed by paired-end sequencing (2 × 150 bp) on a NovaSeq X Plus platform (Illumina) targeting a mean coverage of 300×. Sequencing data were processed using the Sarek pipeline (v3.5.1) from the nf-core workflow collection. Quality of reads was assessed with FastQC (v0.12.1) and adaptors and low-quality bases were removed using fastp (v1.0.1). Reads were aligned to the GRCh38 reference genome using BWA-MEM (v0.7.17-r1188), and duplicate marking and base recalibration were performed using GATK (v4.4.0). Somatic variant calling was performed using Mutect2, with subsequent filtering using FilterMutectCalls. Variants were annotated using SnpEff, and quality control metrics were summarized using MultiQC. Variant analysis was restricted to a predefined set of 64 genes associated with CH. Variants were retained based on sequencing depth (>50×), ≥4 supporting reads, VAF ≥2% and a ‘PASS’ filter status. Functional annotation was supported by COSMIC, Cancer Genome Interpreter and ClinVar databases. Mutations were further verified using SAMtools mpileup (v1.20) against the GRCh38 reference genome and by manual inspection in IGV. CH mutations were defined as somatic pathogenic variants with VAF ≥2% in BC samples. Germline variants were distinguished based on allele frequency in paired tumor and blood samples, with variants showing VAF >40% in both compartments classified as likely germline.
Multisample blocks for spatial transcriptomic analyses
FFPE blocks were centrally evaluated by a pathologist and only samples with >10% tumor content (50% for bone lesions), >10 mm2 of volume and >50 µm of thickness left after DNA extraction for NGS were considered for spatial molecular profiling. Due to restrictions imposed by the ST protocol, original blocks were melted and pairs of biopsies SCR-C2D1 were molded together; patient-paired samples were combined in the same block when both biopsies were available. Once multisample blocks were created, at least two consecutive sections of 5 µm were cut for ST and three consecutive sections of 3 µm were cut for additional hematoxylin and eosin (H&E) and IF assays.
ST sample tissue preparation
A single 5-µm section per sample was processed according to the Visium HD Spatial Gene Expression workflow (HD WT Panel Gene Expression, 10x Genomics) with H&E staining for tissue morphology assessment. Images were taken with a microscope Leica DMi8 THUNDER and LASX software (Leica) or with a NanoZoomer S360 scanner (Hamamatsu) at ×20. Resulting libraries were sequenced on a NovaSeq X Plus System (Illumina) with 150 bp paired-end reads, subsequently trimmed to 10x Genomics’ specifications.
ST Visium HD computational analyses
Space Ranger (v4.0.1; 10x Genomics) was run using the GRCh38-2020-A reference transcriptome together with the Visium Human Transcriptome Probe Set (v2.0). FASTQ files were processed to generate gene expression count matrices at the native 2 µm resolution, as well as aggregated into 8 µm and 16 µm bins. In addition, ×20 H&E images were provided to the spaceranger count pipeline to enable cell segmentation-informed count matrices. Unless otherwise specified, analyses were performed using the 8 µm binned data.
Each Visium HD capture area contained two biopsies. To enable downstream separation, Loupe files were visualized in Loupe Browser (v9.0.0; 10x Genomics), and bins were manually annotated using region selection. These annotations were exported as CSV files and used to assign biopsy identity to each bin.
For each sample, count matrices were imported into Seurat (v5.3) using Load10X_Spatial() to generate Seurat objects for downstream analyses.
ST reference-based deconvolution of 8 µm bins
Cellular composition of each 8 µm bin was estimated using robust cell type decomposition (RCTD). As a reference, we used a publicly available single-cell RNA-sequencing dataset of human PCa (NCBI Gene Expression Omnibus database GSE181294). Within each reference sample, only barcodes with valid cell-type annotations were retained. Raw count matrices from all single-cell samples were merged to form a unified reference object. As RCTD operates on raw counts, no additional normalization or transformation was applied to the reference data. For each Visium HD biopsy, raw 8 µm bin counts were loaded and filtered to retain bins with a minimum of 15 total UMIs. RCTD objects were constructed using create.RCTD with parameters UMI_min = 15 and UMI_min_sigma = 1, followed by deconvolution using run.RCTD(method = ‘doublet’). Normalized cell-type weights were obtained using normalize_weights and retained as estimates of cell-type contributions per bin.
ST deconvolution-guided clustering of 8 µm bins
To derive biologically interpretable spatial states, cell-type deconvolution scores were aggregated into broader lineage compartments per bin. Specifically, scores were summarized into the following categories: tumor, epithelial, B/plasma, T/NK, myeloid, stromal and vascular compartments. Aggregation was performed by summing normalized weights of the corresponding cell types:
Compartment | Single-cell annotations |
|---|---|
Tumor | Tumor |
Epithelial | Epitheial_Luminal, Epitheial_Basal, Epitheial_Club, Epitheial_Hillock |
B_plasma | B.cells, plasma.cells |
T_NK | CTL.1, CTL.2, Cycling.T, NK, TNK, Naive.Th, Th1, Th17, Treg |
Myeloid | Macrophage1, Macrophage2, Macrophage3, Mono1, Mono2, Mono3, mDC, PDC |
Stromal | Fibroblasts |
Vascular | Pericytes.1, Pericytes.2, Endothelial.cells.1, Endothelial.cells.2 |
To mitigate sample-specific scaling effects, lineage scores were standardized within each sample (and biopsy) by centering to mean zero and scaling to unit variance.
Clustering was performed using a sketch-based strategy to enable scalability across large numbers of bins. Briefly, up to 150,000 bins were randomly sampled across the dataset and used to compute principal components through truncated principal component analysis (prcomp_irlba, n = 3, centered but not scaled). The resulting low-dimensional representation was clustered using k-means clustering (k = 10, nstart = 10, iter.max = 100).
The learned principal component analysis transformation was subsequently applied to the full dataset, and all bins were projected into the same principal component space. Each bin was then assigned to the nearest k-means centroid using Euclidean distance, yielding cluster labels for all bins. Cluster-level profiles were characterized by computing mean lineage scores as well as mean fine-grained cell-type deconvolution scores per cluster. Based on these profiles, clusters 4 and 6 were identified as enriched for tumor-associated signal. To derive tumor-enriched expression profiles, bins assigned to clusters 4 and 6 were selected within each biopsy. Raw counts from these bins were aggregated to generate tumor-specific pseudobulk expression profiles per sample. The resulting count matrices, along with corresponding metadata, were used for downstream pathway and functional analyses.
Functional annotation and differential gene expression analyses
Gene expression was normalized using the TMM method with voom from limma package in R. Genes with little variation across samples (s.d. ≤ 0.01) and nonprotein-coding genes were removed. To overcome the risk of batch effects, we used removeBatchEffect to correct for dependence between gene expression and the number of bins per sample, and removed genes identified by 10x Genomics as having increased variability between Visium HD reagent batches.
To identify differentially expressed genes, we used the Empirical Bayes linear modeling framework from limma package. Differentially expressed genes were defined by |log2(FC) | > 1 + FDR < 0.05. GSEA was performed using the fgsea package in R. As the source for functional annotation, we used the Hallmark gene sets from MSigDB and a collection of gene sets extracted from the literature. All the gene signatures used in the analyses are described in Supplementary Table 11. Exploratory analyses were performed to investigate associations between tumor transcriptional programs and clinical outcome. For pathway enrichment analyses, patients were categorized according to radiographic or clinical PFS into long (>30 months) and short (<30 months with a PFS event) PFS groups. Patients with ongoing follow-up beyond 30 months without progression were included in the favorable group, whereas one patient who discontinued treatment early because of toxicity without progression was excluded. Differential pathway enrichment across outcome groups was assessed by GSEA (Fig. 4d,e). Associations between transcriptomic signatures and PFS accounting for censoring were further evaluated using Cox proportional hazards regression models (Extended Data Fig. 8). Single-sample gene set enrichment was performed with GSVA. Cutoffs for differential expression were |log(FC)| > 1, P < 0.05, FDR < 0.05.
Functional HRR test by RAD51 IF
IF for γH2AX (marker of DNA damage), geminin (GMN) and RAD51 (marker of HRR) was performed in 3 µm sections from FFPE blocks following our previously described protocol35. RAD51 foci were quantified only in GMN-positive cells. Scores were assessed on live images using a ×60 immersion oil objective with a Nikon Eclipse Ti-E microscope. To be considered evaluable, specimens should present at least 30 GMN-positive cells and more than 25% γH2AX/GMN-positive tumor cells. RAD51 was quantified in tumor areas by scoring the percentage of GMN-positive cells presenting RAD51 nuclear foci.
Notably, all samples were independently evaluated in a blinded manner by both a pathologist and a biologist, ensuring a double-blind assessment for every case.
Orthogonal cohort for IF assays
IF analyses were pursued in an additional sample set from the NCT01409200 clinical trial. In brief, 73 patients with newly diagnosed PCa were enrolled at The University of Texas MD Anderson Cancer Center. Patients with cTxN1M0 or cTxNxM1a disease, or those at very high risk of subclinical N1 disease, received ADT for 2 months. After an on-treatment biopsy, patients were randomized 2:1 to receive axitinib plus ADT or continue ADT alone for an additional 4 months before surgery. We performed IF assays in all prostate or lymph node available biopsies from the baseline (n = 41) and 2 months on ADT (n = 31) time points with sufficient tumor content, using the same methodology and criteria for evaluability described above. Results from the NCT01409200 study have been previously reported in ref. 36.
Reporting summary
Further information on research design is available in the Nature Portfolio Reporting Summary linked to this article.



