
I trust you are good.
Below is my analysis of the current AUDUSD chart.
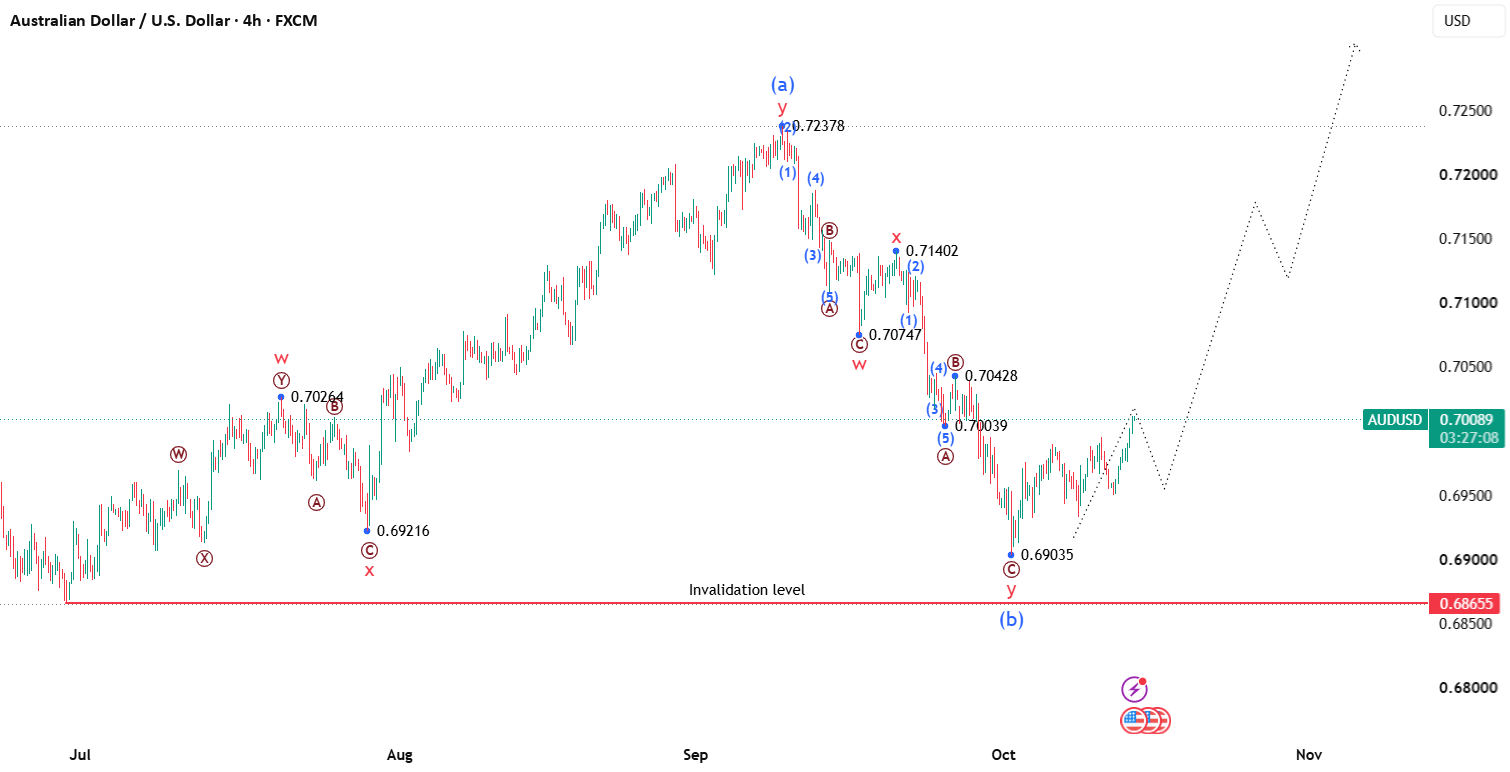
AUDUSD price action from the late-June low at approximately 0.6866 looks like a flat correction to me. This is why:
Wave (a): Advanced in a W-X-Y double zigzag, peaking at 0.72378. The W leg topped at 0.70264, followed by an X-wave decline to 0.69216.
Wave (b): Developed into another W-X-Y correction. The W leg formed an A-B-C decline to 0.70747, followed by an X-wave rebound to 0.71402. The final Y leg completed an A-B-C decline, bottoming at 0.69035 in early October.
Bullish outlook: Wave (b) retraced approximately 90% of wave (a), which is consistent with a regular or expanded flat correction. If the count holds, the next move could be a five-wave advance in wave (c), potentially exceeding the wave (a) high at 0.72378.
A wave (c) equal in length to wave (a) projects toward approximately 0.7276, while a 1.236 extension points toward 0.7364. This places the 0.7300 area within a reasonable upside target zone.
Invalidation level: 0.68655. A decisive break below this level would invalidate the proposed flat-correction count.
The key level to watch is 0.68655. As long as it holds, the bullish wave (c) scenario remains viable.
Cheers and happy trading!!!



