
The UCSB HAS (spontaneous menopause cohort) was approved by the institutional review board of UCSB (UCSB Human Subjects Committee). The UKB received approval from the North West Multicentre Research Ethics Committee and is overseen by an independent Ethics and Governance Council. WRAP was approved by the University of Wisconsin Institutional Review Board. UCSF BrANCH was approved by UCSF Institutional Review Board. ADNI was approved by local institutional review boards or equivalent ethics committees at each participating site. All participants provided informed consent.
Spontaneous menopause cohort participants
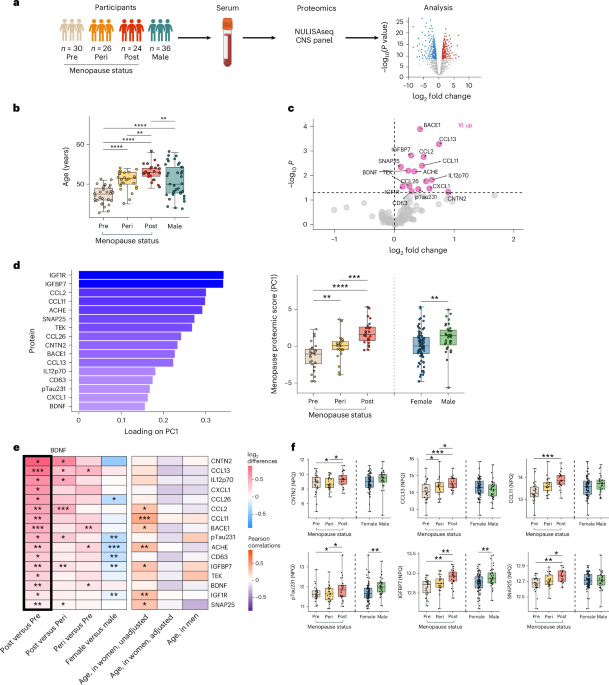
The UCSB HAS recruited approximately equal numbers of pre-, peri- and postmenopausal women (n = 80) plus age-matched men (n = 36). Menopause was staged following STRAW+10 criteria24. Participants were aged 35–60 years, not currently taking menopausal hormone therapy, and did not have any notable medical conditions. Participants who were not taking hormonal contraceptives were prioritized for recruitment, resulting in a sample that was largely free of exogenous hormones (N = 1 on oral contraceptives). Female participants were required to have an intact uterus and no history of bilateral oophorectomy. Female participants self-reported how often they experienced commonly endorsed menopause symptoms44,45 including hot flashes, night sweats, vaginal dryness and irritability in the last 2 weeks, on a scale of ‘not at all,’ ‘1–5 days,’ ‘6–8 days,’ ‘9–13 days’ or ‘every day.’ Due to the small sample size, each individual symptom was dichotomized as present versus absent.
Endocrine assays
In the UCSB HAS, serum was analyzed for gonadotropin and sex steroid hormones: FSH, 17β-estradiol, progesterone, SHBG, DHEAS and testosterone. All participants fasted for 8 h before a morning venous blood draw. Women who were still menstruating were scheduled in the early follicular phase (day 3–5) of their menstrual cycle, pursuant to subject report. Serum was analyzed at the Brigham and Women’s Hospital Research Assay Core. 17β-estradiol, progesterone, and testosterone were determined by liquid chromatography mass-spectrometry, and FSH, SHBG and DHEAS by chemiluminescent immunoassay (Beckman Coulter). Assay sensitivities, dynamic range and intra-assay coefficients of variation (CVs) (respectively) were as follows: estradiol, 1 pg ml−1, 1–500 pg ml−1, <5% relative standard deviation (RSD); progesterone, 0.05 ng ml−1, 0.05–10 ng ml−1, 9.33% RSD; testosterone, 1.0 ng dl−1, 1–2,000 ng dl−1, <4% RSD; FSH, 0.2 mIU ml−1, 0.2–200 mIU ml−1, 3.1–4.3%; SHBG, 0.33 nmol l−1, 0.33 200 nmol l−1, 4.5–4.8%; DHEAS, 2 μg dl−1, 2–1,000 μg dl−1, 1.6–8.3%. All six hormones were measured in women, and the latter three were measured in men. Hormone levels were log-transformed and expressed in s.d. units to aid interpretability.
Blood proteomics
Serum (menopause cohort) or plasma (aging cohorts) was analyzed on the NULISAseq CNS panel to measure 127 proteins in UCSB HAS, 131 in ADNI, 132 in BrANCH and 122 in WRAP25,46,47. The automated Alamar Argo HT workflow generated immunocomplexes tagged with both sample-specific and target-specific DNA barcodes. Samples were pooled into a single library for next-generation DNA sequencing. Samples were randomized (nonstratified) across plates and run in singlet, per previously established procedures for NULISA assays25,47. Batch (plate) effects were mitigated using the standard NULISA protein quantification (NPQ) protocols and algorithm (as described previously)47, including hierarchical normalization that consists of internal spike-in controls for well-level normalization, pooled interplate controls to harmonize protein measurements across plates and negative controls to estimate background and limits of detection. Protein concentrations were reported in NPQ units, which are computed by normalizing the relative concentration of each analyte using internal and inter-plate controls and log2-transforming the normalized values. Plate- and sample-level quality control (QC) metrics (for example, CV, detectability) were used to assess assay performance. The limit of detectability is determined as the mean plus three times the s.d. of the exponentiated (that is, anti-log-transformed) normalized counts for the negative control samples on the plate, which are run in quadruplicate. Detectability is then calculated as the percentage of samples in which the quantification is above the limit of detectability for that target.
In all cohorts, QC metrics were in acceptable ranges, including for both intraplate internal (UCSB HAS: 15.0%; BrANCH: 7.3%; ADNI: 5.9%; WRAP: 0.01–7.5%; all within maximum threshold of 25%) and interplate (UCSB HAS: 4.0%; BrANCH: 8.6%; ADNI: 11.8%; WRAP: 0.29–5.6%; all within maximum threshold of 15%) control CV. In the UCSB HAS, eight proteins (UCHL1, SNCB, PTDP43409, PTN, p-Tau217, OligoSNCA, IL1B and NRGN) had median detectability of <50%, so were removed from analyses following previous work with the NULISA panel48. In all other NULISA cohorts (BrANCH, ADNI), our analyses were restricted to the 16 menopause proteins identified in the UCSB HAS. All 16 of these menopause proteins were detectable (≥50%) in BrANCH and WRAP and all except SNAP25 were detectable (≥50%) in ADNI. SNAP25 was removed from analyses in ADNI. Given that APOE4 protein expression proxies APOE4 genotype (bimodal distribution), we excluded APOE4 from proteomics analyses. In the UCSB HAS, APOE4 levels were used to infer APOE4 allele carriage (APOE4 ≥ 10 NPQ categorized as carrier, APOE4 < 10 NPQ categorized as noncarrier; Supplementary Fig. 3). A full list of proteins in each cohort is provided in Supplementary Table 16.
To reduce the influence of extreme values, all protein concentrations were winsorized at the three-interquartile limit. There were no missing values on any examined proteins in the UCSB HAS cohort. No imputation was used for NULISAseq data, and analyses in other NULISA cohorts (BrANCH, ADNI, WRAP) were restricted to participants with nonmissing values on all menopause proteins. Given all analyses examined proteomic outcomes within cohorts separately, we did not normalize protein levels between cohorts.
Cross-cohort, cross-platform validation in UKB
To evaluate whether spontaneous menopause proteomic shifts were robust to cohort and proteomic platform, we compared spontaneous menopause protein effect sizes detected in the midlife menopause cohort with NULISAseq proteomics to menopause protein effect sizes detected in a large cohort of 2,814 women from the UKB with cross-sectional proximity extension assay Olink proteomics49. The UKB is a population-based prospective cohort study with multiomics and clinical data on approximately 500,000 participants aged 40–69 years. The UKB Pharma Proteomics Project (UKB–PPP) consortium generated proximity extension assay Olink plasma proteomics data on a subset of participants’ baseline samples, resulting in up to 2,923 protein measurements from 52,995 participants in the post-UKB–PPP quality control dataset. Details of proteomics data generation, processing and QC have been described previously49 and are available at https://biobank.ndph.ox.ac.uk/ukb/ukb/docs/PPP_Phase_1_QC_dataset_companion_doc.pdf and https://biobank.ndph.ox.ac.uk/crystal/ukb/docs/Olink-3072_B0-B6_Analysis-Report.pdf. In brief, samples were aliquoted using a pseudorandomization algorithm to maximize variation of phenotypes on each generated sample plate, balancing factors such as age, sex, day of the week of blood collection, self-reported ethnicity and deprivation index49. QC metrics were all in acceptable ranges for Olink proteomics, including median intraplate CVs <8%, median interplate CVs <11%, median interinstrument CVs <11% and 73.2% of proteins had <30% of measurements falling below the limits of detectability49. Normalized protein expression values were calculated per standard, previously described algorithms that include normalizing for both plate-to-plate and batch-to-batch variation. To maintain consistency with other published UKB proteomics papers49,50, we used the standard, postquality control UKB Olink dataset consisting of 2,923 unique proteins, including 13 of the menopause proteins identified in UCSB (p-tau231, BACE1 and IL-12p70 were not measured in UKB).
A total of n = 17,487 female participants reported being postmenopausal at baseline (answered ‘yes’ to ‘Have you had your menopause (periods stopped)?’), and n = 6,542 female participants reported not being postmenopausal at baseline (answered ‘no’; n = 3,272 with hysterectomy and n = 1,231 not sure/prefer not to answer excluded). Of the resultant sample of n = 24,029 pre-/peri- and postmenopausal women, we further restricted our menopause analyses to participants who reported no history of bilateral oophorectomy (n = 22,809; n = 1,220 excluded), no current use of menopausal hormone therapy (n = 21,910; n = 899 excluded) and who were aged 45–60 years at the time of the Olink blood draw to mirror the UCSB HAS sample more closely (n = 10,926 (N = 3,789 pre-/peri-menopausal, n = 7,137 postmenopausal); n = 10,984 excluded).
To mitigate the confound between age and menopause status, we created age-matched samples of pre-/peri- and postmenopausal women (R ‘MatchIt’ package). Pre-/peri- and postmenopausal women were matched on a 1:1 ratio using k-nearest-neighbor (KNN) matching without replacement and a 0.05 s.d. caliper. This resulted in a sample of n = 1,407 pre-/peri-menopausal women and n = 1,407 postmenopausal women who were nearly matched exactly on age (Fig. 4a and Supplementary Table 6) for validation analyses.
Aging cohorts
To evaluate the relevance of menopause-related biological changes to later-life cognitive outcomes, we used proteomics data from women in four independent aging cohorts.
ADNI (aging cohort 1)
Data used in the preparation of this article were obtained from the Alzheimer’s Disease Neuroimaging Initiative (ADNI) database (adni.loni.usc.edu). The ADNI was launched in 2003 as a public-private partnership, led by Principal Investigator Michael W. Weiner, MD. The primary goal of ADNI has been to test whether serial magnetic resonance imaging (MRI), positron emission tomography (PET), other biological markers, and clinical and neuropsychological assessment can be combined to measure the progression of mild cognitive impairment (MCI) and early Alzheimer’s disease (AD). ADNI is an international multisite observational study that follows older adults across the cognitive spectrum (that is, cognitively normal, MCI and AD)51. No data were collected on menopause history or symptoms. Participants underwent repeated cognitive assessments and blood collection every 6–12 months. To quantify global cognition, we examined the ADNI modified Preclinical Alzheimer’s Cognitive Composite score, which was computed by averaging sample-based z-scores on the Alzheimer Disease Assessment Scale—Cognitive Subscale Delayed Word Recall, Logical Memory Delayed Recall, the Mini Mental State Examination and (log-transformed) Trail-Making Test B Time to Completion52. For a subset of ADNI participants (n = 1,248), baseline plasma was analyzed for 131 proteins on the NULISAseq CNS platform. Our analytic sample included n = 673 female participants who had NULISAseq data and cognitive test data available. To characterize the sample, amyloid positivity was determined using the derived ADNI variable ‘AMYSTAT,’ which uses validated, tracer-specific quantitative thresholds to classify participants’ amyloid status as ‘elevated’ or ‘not elevated’ from harmonized Aβ PET data53,54.
UCSF BrANCH (aging cohort 2)
BrANCH is a study of community-dwelling, functionally intact participants who undergo annual neuropsychological testing and blood draws. Female participants self-reported their histories of hormone therapy use and oophorectomy. A composite score of global cognition was computed by averaging sample-based z-scores for tests of memory (California Verbal Learning Test II immediate and delayed recall), executive function (Stroop interference, modified Trail-Making Test, phonemic fluency and Digit Span Backwards), and processing speed (six computerized visually based tests of Length Judgment, Visual Search, Distance Judgment, Abstract Matching 1, Abstract Matching 2 and Shape Judgment), described previously55. Baseline plasma was analyzed for 132 proteins on the NULISAseq CNS platform. Our analytic sample included n = 100 female participants with NULISAseq who had cognitive data available. Baseline plasma p-tau181/Aβ42 was assayed on Simoa (Quanterix) across three batches in the broader BrANCH cohort (1,266 samples across n = 664 participants). Batch effects were quantified by linear regression on samples shared across batches, with model estimates applied subsequently to all samples to align cross-batch values on the same scale. To characterize the sample, amyloid positivity was determined using a sample-specific, batch-harmonized p-tau181/Aβ42 threshold that optimized classification of visually read Aβ-PET 18F-AV45 positivity in the broader BrANCH cohort (area under the receiver operating characteristic curve = 0.88).
WRAP (aging cohort 3)
WRAP is an observational study enriched for participants with a parental history of AD. Participants completed clinical and cognitive testing and blood collection approximately every 2 years. Female participants self-reported their histories of hormone therapy use, oophorectomy and menopause symptoms. Menopause symptoms reported included hot flashes, night sweats, sexual dysfunction, problems sleeping, mood swings and depression, which together are among the most common and distressing menopause symptoms observed in midlife women56,57,58,59,60,61, plus total symptom count. A composite score of global cognition was calculated by averaging sample-based z-scores on tests for memory (Rey Auditory Verbal Learning Test total learning and delayed recall, Logical Memory IA and IIA) and executive function (Trail-Making Test Part B, Weschler Adult Intelligence Scale–Digit Symbol Substitution Test and Animal fluency). Plasma samples from a subset of recent WRAP visits (2017–2024) were analyzed for 122 proteins on the NULISAseq CNS kit46. Given the lack of sufficient follow-up after the NULISAseq blood draw, we restricted our analyses to cross-sectional data. Our sample included n = 93 female participants who had cognitive data available within 30 days of NULISA blood collection. Plasma p-tau217/Aβ42 was measured on the Lumipulse G System (Fujirebio) at the Michael T. Zuendel Biomarker Laboratory at Banner Sun Health Research Institute. To characterize the sample, amyloid positivity was determined using a threshold of >0.008 (ref. 62).
UKB (aging cohort 4)
To assess whether menopause-related proteomic shifts predict risk for dementia, we used data from N = 11,059 women ≥50 years old in the UKB with nonmissing values for all 13 menopause proteins measured on Olink at study baseline. Participants were free from known dementia at baseline and followed for a mean (s.d.) of 15.7 (2.84) years. Consistent with previous work, incident dementia cases were defined algorithmically using a combination of information in International Classification of Diseases diagnosis codes in linked primary care, hospital inpatient and death registry data, for all-cause dementia (codes A81, F00 to F03, F05, F10, G30, G31 and I67), alongside AD (F00 and G30), vascular dementia (F01 and I67) and frontotemporal dementia (F02 and G31)50. Participants were censored at first dementia diagnosis, death or September 2025, representing the most recent update of algorithmically defined dementia outcomes in the UKB.
Analyses
Analyses were conducted in R (v4.5.0) and Python (v3.11.14). Descriptive statistics and analysis of variance (ANOVA), t-tests and χ2 tests summarized demographic and clinical characteristics in each cohort.
Spontaneous menopause cohort
Age-adjusted analysis of covariance (ANCOVA) compared levels of 126 NULISAseq proteins by menopause stage (pre, peri or post). Menopause proteins were identified as those that differed between pre- and postmenopausal women per nominal statistical significance (unadjusted P < 0.05). All further analyses focused exclusively on these proteins. We performed a PCA on the identified menopause proteins in all midlife women and extracted the first component (PC1) as a ‘menopause proteomic score.’ To limit comparisons, the menopause score was used as the primary measure for all further analyses, with effects of individual proteins examined in post hoc analyses. Separate age-adjusted regressions tested the associations of menopause stage and sex with the menopause score.
Although menopause definitionally involves endocrine shifts, different hormones may relate to unique aspects of menopause biology. To probe this, age-adjusted regressions tested associations between sex hormones and the menopause proteomic score in all midlife women. Among peri- and postmenopausal women, separate regressions tested associations of menopause symptoms with the menopause score, adjusting for age and menopause stage.
Cross-cohort, cross-platform validation
In the age-matched sample of pre-/peri- and postmenopausal women in the UKB, age-adjusted regression models tested associations between menopause status (post versus pre/peri) and 2,923 Olink proteins, with FDR correction. For the menopause proteins identified in UCSB (NULISAseq) that were measured on Olink, we examined whether these proteins also differed between pre-/peri- and postmenopausal women in the UKB, including estimated proteomic effect sizes between cohorts. We performed post hoc GO and pathway enrichment using the publicly available GO parallel code (https://www.github.com/edammer/GOparallel)63.
We also tested associations of menopause stage with proteomic clocks of organ and cellular aging50,64. Using publicly available code for established Olink models, we calculated proteomic aging clocks for 13 organ systems (github.com/hamiltonoh/organageUKB) and 38 cell types (github.com/dingdaisy/cellage)50,64. Organ and cell clock models were developed using proteins that are labeled as enriched for the corresponding tissue or cellular sources in the Human Protein Atlas65, such that proteins that load onto each organ- or cell-specific model are assumed to originate at least in part from those organs and/or cells50. Because the organ and cell clock estimations required complete data, these analyses were performed on a subset of n = 2,340 age-matched pre-/peri- and postmenopausal women following KNN imputation of the Olink data50.
We imputed Olink proteomics data using the entire UKB Olink baseline sample (n = 52,995 participants; n = 2,923 proteins) following a previously published method50. For quality control, we first excluded n = 8,181 samples with more than 1,000 proteins missing, 7 proteins with missing values in more than 10% of samples, and 338 samples with discordant self-reported sex and genetic sex, resulting in a final dataset of n = 44,476 participants with 2,916 protein measurements. We performed missing value imputation of the Olink data using KNN imputation. We split the data into train and test, where each split comprised 11 randomly selected UKB assessment centers (train centers: Newcastle, Nottingham, Bristol, Leeds, Sheffield, Glasgow, Wrexham, Croydon, Hounslow, Edinburgh, Reading; test centers: Barts, Birmingham, Bury, Cardiff, Liverpool, Manchester, Middlesborough, Oxford, Stockport, Stoke, Swansea). Protein levels were z-transformed using the mean and s.d. values of the train split. Using scikit-learn’s KNNImputer function (scikit-learn.org), we trained a KNN imputer where the number of neighbors (k) was set to the square root of the sample size in the train split (k = 166). We assessed the imputer’s performance on n = 5,590 samples (3,425 train; 2,165 test) with no original missing protein values. To do so, we input missing values randomly into this ‘ground truth’ subsample at 3% (equivalent to the missing value rate in the entire post-QC dataset). We then used the imputer on this subsample to calculate the error between imputed values and ground truth values. This resulted in a total mean error rate of 0.57 in both the train and test samples, consistent with previous research50 and supporting robust imputation of the Olink data (Supplementary Fig. 4).
Chronological age-adjusted linear models tested associations of age at menopause with organ and cell age ‘gaps’ (that is, z-scored residuals of proteomic predicted age linearly regressed against actual age, whereby larger gaps reflect more advanced biological aging).
Aging cohorts
We extracted loadings and summary statistics for the menopause score (PC1) calculated in the spontaneous menopause cohort to compute an equivalent score in each aging cohort. To accommodate varying protein availability between aging cohorts (Supplementary Table 16), we recomputed several versions of PC1 in the spontaneous menopause cohort after (1) removing SNAP25 for use in ADNI; (2) removing BDNF for use in WRAP and (3) removing BACE1, IL-12p70 and p-tau231 for use in UKB. Loadings for the remaining shared proteins among the versions were very similar (Supplementary Fig. 5).
In WRAP, linear regressions tested associations of menopause symptom history with the menopause score, adjusting for age, history of hormone therapy and bilateral oophorectomy.
To examine the relevance of the menopause score to cognitive aging outcomes, in ADNI and BrANCH, linear mixed-effects models tested associations of the interaction between the score and time on global cognition, adjusting for baseline age and education. In WRAP, a linear regression tested the association of menopause score on global cognition, adjusting for age and education. In the UKB, Cox proportional-hazards models tested associations of the menopause score with risk for incident dementia (AD, frontotemporal, vascular, all-cause), adjusting for age.
Sensitivity analyses
To further address the possibility that menopause proteomic differences are driven by chronological (versus endocrine) aging, we performed sensitivity analyses repeating models in a subsample of participants with a tightly restricted age range (47–53 years; N = 54 total; n = 17 pre-, n = 22 peri-, n = 15 postmenopausal). These analyses yielded very similar findings to the main results (Extended Data Fig. 5 and Supplementary Table 14), suggesting the observed proteomic differences between menopause groups were not confounded substantially by chronological age. In the UKB age-matched validation cohort, we re-ran differential abundance analyses, also adjusting for factors that systematically differed between pre- and postmenopausal women (years of education, history of hormone therapy use, current hormonal contraceptive use, ethnicity, smoking status, low-density lipoprotein (LDL) cholesterol and glycated hemoglobin (hbA1c)), which yielded highly consistent findings to the main analyses (Supplementary Fig. 6). In all cohorts, we also re-estimated models after adjusting for cardiometabolic comorbidities and common health-related risk factors that may influence the proteome, per available data in each cohort. These covariates included: UCSB HAS: BMI, smoking history and self-reported histories of high blood pressure, high cholesterol and diabetes; ADNI: BMI, smoking history, systolic blood pressure and diastolic blood pressure; BrANCH: BMI, smoking history, systolic blood pressure, diastolic blood pressure, hbA1c and LDL cholesterol; WRAP: BMI, smoking history, systolic blood pressure, diastolic blood pressure, fasting glucose and LDL cholesterol; UKB: BMI, smoking history, systolic blood pressure, diastolic blood pressure, hbA1c and LDL cholesterol. All analyses yielded similar results to main models (Supplementary Tables 14 and 15).
In aging cohorts, we performed additional sensitivity analyses re-estimating models after excluding participants who self-reported a history of bilateral oophorectomy (not available in ADNI) and stratified by history of hormone therapy (ever used versus never used; also not available in ADNI), which also yielded similar findings (Supplementary Tables 9 and 15). Furthermore, given the known associations of plasma p-tau with cognitive decline and AD risk, we computed an alternate version of the menopause signature excluding p-tau231 (Supplementary Fig. 5). Analyses excluding p-tau231 yielded a very similar pattern of results to the main analyses (Supplementary Table 15). In ADNI, BrANCH and WRAP, which had detailed information on baseline cognitive diagnoses, we also re-estimated models after excluding participants with MCI or dementia at baseline, which again produced similar findings (Supplementary Tables 9 and 15).
In both the UCSB HAS and aging cohorts, we finally performed exploratory analyses testing effect modification by APOE4 genotype (that is, carrier versus noncarrier). APOE4 carriage was inferred using NULISAseq serum levels of the APOE4 protein in the UCSB HAS cohort (Supplementary Fig. 5) and was determined using genetic data for the single-nucleotide polymorphisms rs429358 and rs7412 in the aging cohorts (ADNI, BrANCH, WRAP and UKB). These showed largely null effects, with the exception that APOE4 carriage significantly exacerbated associations of menopause proteomic scores with cognitive changes in ADNI (Supplementary Tables 14 and 15 and Extended Data Fig. 6).
Reporting summary
Further information on research design is available in the Nature Portfolio Reporting Summary linked to this article.



