
Study design and sample collection
For WGS activities, we leveraged clinical samples collected as part of ongoing health facility-based molecular14,34,53 and parasitological21,22 surveillance activities. Briefly, molecular surveillance samples were collected from individuals aged >6 months diagnosed with malaria by rapid diagnostic test or microscopy at up to 16 health facilities across Uganda between 2016 and 2024. Following written informed consents, dried blood spots were collected by finger prick. For parasitological surveillance, individuals aged >6 months diagnosed with high parasitemia malaria by microscopy at health facilities near parasitology laboratories in Tororo, Tororo District in eastern Uganda and Kalongo, Agago District in northern Uganda between 2016 and 2024 were consented and up to 5 ml of blood was collected into heparin tubes by venipuncture. From these samples, we used pre-existing genotyping and ex vivo drug susceptibility data14,22 to select low COI samples with K13 mutations, low lumefantrine and/or DHA susceptibility or high RSA survival. Each of these samples was then matched by collection year and site with a low COI sample encoding a wild-type K13 allele or having unremarkable lumefantrine and DHA susceptibility profiles.
To estimate prevalences of px1 genotypes over time, we performed long-read ONT sequencing on a random subset of 50 samples that had undergone ex vivo drug susceptibility assessment from each site for each year of surveillance activity (50 each year from 2016 to 2024 for the eastern region and 50 each year from 2021 to 2024 for the northern region). For each year when ex vivo samples were not available from the north, we sequenced a random subset of 50 molecular surveillance samples collected from the Patongo health facility. Finally, to provide an understanding of changes in px1 diversity in the early stages of AL utilization, we evaluated 91 pretreatment samples collected as part of a 2004 therapeutic efficacy study54 and 92 samples collected per year in 2008 and 2012 from children (aged <5 years) enrolled in a cohort study55,56. Both studies were conducted in Tororo.
Library preparation, whole-genome sequencing and variant calling
Genomic DNA extracted from dried blood spots underwent two rounds of specific whole-genome amplification, as previously described57. The amplified products were combined, and WGS libraries were prepared using the Watchmaker DNA Library Kit with Fragmentation (Watchmaker Genomics). The resulting libraries were pooled and sequenced using Illumina 2 × 150 bp chemistry at Psomagen on an Illumina X Plus (Psomagen). After sequencing, Trimmomatic was used to trim off adapters and select properly paired reads before mapping. Reads were competitively mapped onto a hybrid reference genome obtained from the concatenation of P. falciparum 3D7 (version 3.1) and human genome assembly (version GRCh38) using BWA-MEM (version 0.7.17-r1188). We used Samtools (version 1.19.2) and GATK (version 4.3.0.0) to select and clean reads that specifically mapped to the P. falciparum genome. Samples with a human-to-parasite read ratio <10 were retained and those among these with low sequencing depth (first quartile of read depth <35×) were repooled and rebalanced for another NovaSeq X Plus run. Cleaned binary alignment map files from different sequencing runs were merged before variant calling using a P. falciparum-optimized GATK4 pipeline (https://github.com/Karaniare/Optimized_GATK4_pipeline/tree/main), as previously described35. An accurate in silico positive training dataset built in the pipeline was used for machine learning variant recalibration accounting for multiple mapping parameters including read depth, mapping quality and strand bias. Variants that failed this filtering were removed, as were samples and variants with genotype missingness >10% and >20%, respectively. Subtelomeric and internal hypervariable regions that are hard to map were excluded from the variant call format (VCF) file to focus the downstream analysis on the core genome as previously defined58. The fraction of reads supporting the alternate allele was added in the format field to enable detection of major alleles in mixed infection samples.
Estimation of complexity of infection
We selected high-quality SNPs with MAF ≥ 2% and <10% genotype missingness to estimate COI using The REAL McCOIL package59 as implemented in the MIPTools pipeline. The total number of Markov chain Monte Carlo (MCMC) was set to 2,000 with 500 burn-in iterations.
Selection analysis
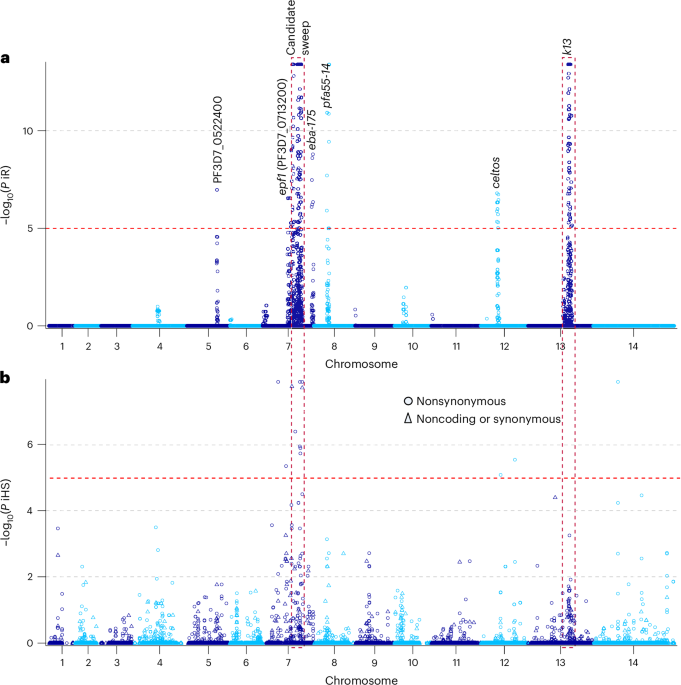
The rehh R package (version 3.2.2)60 was used to estimate the EHH around specific makers and to scan the genome for allele-specific iHS signals from filtered VCFs. An initial analysis was performed with all the SNPs at MAF ≥ 2% in monogenomic samples. Tajima’s D analysis was also performed in this SNP set using VCF-kit (version 0.2.9)61 to identify balancing selection signals, likely reflecting immune-mediated pressure. For the iHS scan, SNPs with Tajima’s D > 1 or present at MAF ≥ 5% in the Pf6 dataset from samples collected up to 2015 were excluded to enrich for signals of recent directional selection. Raw iHS values were standardized within derived-allele frequency bins (bin size = 50) to correct for allele-frequency dependence. Statistical significance was assessed assuming a standard normal distribution of the standardized iHS values, and two-sided P values were calculated as P = −log10(2Φ(−|iHS | )), where Φ is the cumulative distribution function of the standard normal distribution, corresponding to a two-sided Z-test with an empirically derived null distribution60. A minimum of four haplotypes was required for evaluation at each locus. Multiple testing correction was performed using the Benjamini–Hochberg procedure as implemented in the R function p.adjust to control the FDR.
isoRelate (version 0.1.0) iR statistics was also used to scan the genome for recent positive selection signals based on IBD50. IBD segments were inferred allowing a genotyping error of 0.001, using all SNPs with MAF ≥ 2% following recalibration filtering. Only shared IBD segments ≥50 kb in length and supported by at least 20 SNPs between sample pairs were retained. The isoRelate function getIBDiR was used to compute pairwise iR statistics per SNP across the full sample set and after stratification by K13 mutation status or sampling regions. Statistical significance of iR was evaluated using empirical two-sided P values derived from the genome-wide distribution of iR statistics, defined as the proportion of loci with absolute iR values greater than or equal to the observed value. Multiple testing corrections for iR were conducted as for iHS.
To further characterize the selection sweeps detected across the genome, SnpEff annotations were used to identify whether SNPs are nonsynonymous or synonymous or from noncoding regions. The delta changes of allele frequencies for these SNPs over time were also calculated. For more robust analysis of spatiotemporal change in PX1 mutations, prevalences of detected haplotypes were calculated from 2008 to 2024 in the east and from 2016 to 2024 in the north. A linear regression model was used to measure the increase of haplotype frequencies over time in each region.
Haplotype visualization
A subset of the quality-filtered WGS VCF containing SNPs with MAF ≥ 2% from the px1 flanking region was extracted. Polygenomic and low coverage (read depth <50) samples were removed. The VCF subset was converted into a genotype table with two values (0 and 2) containing samples in the rows and SNP positions in the columns. The genotype table was visualized using ComplexHeatmap R package (version 2.21.1) (https://jokergoo.github.io/ComplexHeatmap-reference/book/a-single-heatmap.html). The complete-linkage clustering method was applied to cluster samples based on their relatedness. Metadata variables were added as bar plots to the heatmap and included PX1 mutations, K13 mutations, region and year of sample collection.
Recombination analysis
The LDhat package (version 2.2a)62 was used to estimate per locus recombination rates using SNPs with MAF ≥ 1% and monogenomic samples. A likelihood lookup table of 192 sequences was generated to compute sample recombination rate profiles using composite likelihood and piecewise constant model62,63. A total of 10,000,000 MCMC iterations and a background block penalty of 5 were used, as well as 100,000 burn-in iterations and 2,000 MCMC iterations between samples.
px1 genotyping using Oxford Nanopore Technologies
To resolve px1 haplotypes, we designed primers (Supplementary Table 5) tiling across the gene using the Multiply2 package (https://github.com/JasonAHendry/multiply) developed for multiplex PCR panel design for ONT sequencing. Minimum and maximum amplicon sizes were 1,605 and 2,319 bp (Supplementary Table 5), respectively. Two rounds of long-range PCR were performed with GoTaq master mixes (Promega). The first PCR (30 cycles) amplified targeted regions from the genomic DNA template using each primer set in separate simplex reactions (Supplementary Table 5). Forward (5′GACTCGCCAAGCTGAAGNNNN3′) and reverse (5′ACGTGTGCTCTTCCGATCTNNNN3′) primers were attached to linkers, oligo-sequences containing binding sites for Illumina barcoding primers. The second PCR (ten cycles) was performed to barcode the products of the first PCR using Illumina primers attached to indexes. The primer set P2_Px1Block3_v2_F/P2_Px1Frag3_v8_R (894851–897457) spanning the PIN haplotype variants was used for large scale genotyping. After barcoding, all samples were pooled and bead cleaned for ONT library preparation. A ligation sequencing kit (SQK-LSK114) was used without ONT barcoding, because samples were already barcoded using Illumina indexes. The library pool was sequenced using a PromethION 2 Solo device. Duplex super-accurate base calling was performed from pod5 files using dorado (https://github.com/nanoporetech/dorado). The sam file obtained from the base calling step was converted into a fastq file before demultiplexing using the elucidator package (https://github.com/nickjhathaway/elucidator). The reads were mapped onto Plasmodium falciparum 3D7 reference genome (version 3.0) using minimap2.0 (https://github.com/lh3/minimap2) and the bcftools package (version 1.13) was used for variant calling with ONT-optimized settings (https://samtools.github.io/bcftools/howtos/variant-calling.html). Samples with read depth <25× (10 of 1,608) were removed from the analysis. Samples carrying mutations that are supported by fewer than 50% of reads (88 of 1,608) were also excluded from the analysis to prevent any ambiguity due to contamination during the PCR steps.
In vitro 72-hour drug susceptibility assay of genetically manipulated parasites
px1 genetically manipulated parasites37 were grown in complete RPMI medium in the presence of 2.5 nM WR99210 (Jacobus Pharmaceuticals) and washed human red blood cells (Interstate Blood Bank) at 5% crit at 37 °C under a gas mixture of 5% CO2, 5% O2 and 90% N2. Incomplete medium consisted of RPMI 1640 with l-glutamine (Gibco), supplemented with 50 mg l−1 hypoxanthine (Calbiochem) and 25 mM HEPES (Corning). Complete medium was prepared by adding 0.5% Albumax II (Gibco), 10 mg l−1 gentamicin (Gibco) and 0.225% NaHCO3 to incomplete culture medium. Cultures were enriched for schizonts by Percoll gradient centrifugation and left to invade RBCs for 6 h. Parasites at 2% hematocrit and 0.2% parasitemia were grown for 72 h in the presence of different concentrations of drugs in 96-well plates. Growth at 72 h was measured by SYBR Green (Invitrogen) staining of parasite DNA on a plate reader (Flexstation 3). A dilution series of the drugs was carried out in three biological replicates. Relative fluorescence units were measured at an excitation of 490 nm and emission of 525 nm on a plate reader and analyzed using GraphPad Prism version 10 (GraphPad Software). IC50 values were determined with the curve-fitting algorithm log(inhibitor) versus response-variable slope.
Geospatial mapping of px1 haplotype frequencies
The VCF obtained after reanalyzing the Pf6 dataset with the optimized GATK4 variant calling pipeline was used to detect px1 genotypes in multiple parasite populations. The prevalences of px1 haplotypes were calculated for each country and plotted on the map (https://www.naturalearthdata.com/) using igraph (version 2.3.0), sf (version 1.0-15), ggrepel (version 0.9.8), ggspatial (version 1.1.10) and rnaturalearth (version 1.2.0) R packages.
Population structure analysis
For allele-based population structure analysis, we selected quality-filtered SNPs with MAF ≥ 2% and LD < 0.20. PLINK (version 2.0.0-a.6.9) was used to calculate the pairwise variance-standardized genetic relationship matrix on which we performed PCA using the FactoMineR (version 2.14) package in R, as previously implemented64. We used factoextra to visualize the results of the PCA.
Identity-by-descent network analysis
Genetic relatedness among samples was assessed by estimating pairwise IBD using filtered genome-wide SNPs. Analyses were restricted to major alleles and SNPs with a MAF ≥ 2%. IBD inference was performed using the hmmIBD package (version 2.0.0)65, with a maximum of 5 fitting iterations, a requirement of at least 200 informative sites per sample pair and an assumed genotyping error rate of 0.1%. IBD networks were constructed using the igraph package (version 2.3.0).
Copy number variation analysis
Copy number variation was analyzed using PathWeaver (version 1.0), a de novo assembler optimized for P. falciparum41 (https://github.com/nickjhathaway/PathWeaver). Accessible regions of chr. 7 were identified by excluding short repetitive sequences using a tandem repeat finder function. PathWeaver uses a de Bruijn graph-based assembly strategy with iterative recruitment of unmapped reads to improve assembly accuracy and provides region-specific summary metrics, including read depth used for each assembly. Per-base coverage across assembled regions was used to assess structural variation along chr. 7. For each sample, per-base coverage values were first normalized by the mean coverage across all assembled regions. These sample-normalized values were subsequently re-normalized by the median normalized coverage for each region across all samples.
Linkage disequilibrium analysis
Filtered genome-wide SNPs with MAF ≥ 2% were used to estimate LD among SNPs in the candidate sweep and between these SNPs and the remainder of the genome using PLINK66. Pairwise LD was quantified as the squared correlation coefficient (r2), computed using the default maximum pairwise distance of 10,000 kb.
Pairwise r2 values between candidate sweep SNPs and SNPs across the genome were visualized to assess LD profiles along each chromosome. To characterize LD decay along chr. 7, mean r2 values were calculated in bins of increasing pairwise genomic distance, with bin sizes incremented in 100-bp intervals. Locally estimated scatterplot smoothing was applied to fit a smooth curve to the mean r2 values as a function of genomic distance.
Ex vivo drug assays
For the published ex vivo data leveraged, drug susceptibilities were assessed using a 72-hour growth-inhibition assay with SYBR Green detection, as previously described22,25. Briefly, threefold serial dilutions of 10 mM (50 mM for pyrimethamine) stocks of chloroquine, monodesethylamodiaquine (the active metabolite of amodiaquine), piperaquine, pyronaridine, mefloquine, lumefantrine, DHA, quinine and pyrimethamine, in Albumax-supplemented complete medium were placed in 96-well microplates (50 μl per well), including drug-free and parasite-free controls. Parasites were diluted with uninfected erythrocytes and added to diluted drugs to a final culture volume of 200 μl at 0.2% parasitemia and 2% hematocrit. Plates were maintained at 5% CO2, 5% O2 and 90% N2 for 72 h at 37 °C in a humidified modular incubator. After 72 h, cells were lysed and stained with 100 μl of SYBR Green lysis buffer, incubated for 1 h in the dark at room temperature and fluorescence (485 nm excitation and 530 nm emission) was measured. IC50 values were derived from plots of fluorescence intensity versus log(drug concentration) and fit to nonlinear curves using a four-parameter Hill equation in Prism.
The ex vivo RSA was performed as previously described25. Briefly, clinical samples were diluted with uninfected erythrocytes to no more than 1% parasitemia and were incubated with 700 nM DHA or, for controls, 0.1% dimethyl sulfoxide for 6 h. Cells were then washed to remove the drug and cultures were maintained for an additional 66 h. Giemsa-stained thin smears were then prepared for exposed and control parasite cultures, parasitemias were counted and RSA survival was calculated as the proportion of viable parasites in the DHA-treated cultures relative to controls.
Genotyping of key antimalarial drug resistance markers
All dried blood spot samples (n = 1,035) were subject to DNA extraction using a Chelex-Tween protocol as previously described67,68. Comprehensive genotyping of existing antimalarial drug resistance markers was performed using both molecular inversion probe and Sanger sequencing.
For molecular inversion probe, the DR2 panel was used as previously described67,68. Briefly, drug resistance targets were captured by oligo-probes into DNA circles which are enriched by digesting linear DNA using exonucleases. A final PCR amplification step was performed to open the circular DNA and add indexes for Illumina sequencing using NextSeq 550. After sequencing, read processing and Freebayes variant calling steps were done using the MIPTools package (https://github.com/bailey-lab/MIPTools). Drug resistance mutation data was filtered and analyzed in R using the miplicorn package (https://github.com/bailey-lab/miplicorn).
Dideoxy sequencing was performed on a subset of samples to supplement k13 genotypes as previously described53. Sequences were evaluated using CodonCode Aligner version 9.0.1 (CodonCode Corporation).
Public whole-genome sequencing dataset
Raw WGS reads from MalariaGEN’s Pf6 release46 were previously downloaded from the Sequence Read Archive and analyzed with the optimized GATK4 pipeline by our laboratory35. The VCF obtained from this variant calling was leveraged to detect common alleles across the genome in global parasite populations. The same data was utilized to estimate and map (Supplementary Methods) frequencies of PX1 mutations in older samples from malaria-endemic countries.
Statistical analysis
Microsoft Excel (versions 97-2003 and 2016) was used for data entry. Data analysis was performed using R (version 4.3.1). Data visualization was performed using R and Adobe Illustrator CC (version 17.0.0). We used the Mann–Kendall test for trend analysis of haplotype prevalence over time in northern and eastern Uganda. The trend by sampling site was analyzed using the Bayesian model with default priors and number of MCMC draws as previously described69.
To evaluate genotype–phenotype associations, we utilized all samples with lumefantrine, DHA or mefloquine IC50 values or RSA data that underwent px1 and k13 sequencing. Wilcoxon rank-sum test (independent sample sets, two-sided) was used to compare phenotype scores (IC50 values or RSA survival rates) between px1 haplotypes (PIN and LMD) with stratifications by different variables including K13 wild-type, 675V and C469Y alleles, region and year.
To assess a potential contribution of confounders in drug susceptibility–px1 haplotype associations, a linear mixed-effects regression model was fitted with site, parasitemia, COI, year of sample collection and K13 mutation status as covariates. For each drug, we calculated the estimated marginal means of IC50 and its confidence interval, P values and Cohen’s d effect size. Values of P < 0.05 indicated statistically significant differences. We estimated both marginal and conditional R2 values as previously described70. Marginal R2 was used to estimate the proportion of variance explained solely by the px1 PIN haplotype. By contrast, conditional R2 was computed to represent the total variance explained by the entire model. We also evaluated the potential synergy between the px1 haplotype and K13 mutations using the mixed-effects model. Each drug assay was modeled with an interaction term between px1 and k13 treated as fixed effects, allowing us to determine whether the phenotypic effect of the PIN haplotype was modified by the K13 C469Y and A675V backgrounds.
Complete-linkage hierarchical clustering method was used to cluster haplotypes flanking the px1 gene based on the genotype matrix in monogenomic samples.
Inclusion and ethics statement
This study arose from a long-standing scientific collaboration among the University of California, San Francisco (UCSF), Brown University, The University of North Carolina at Chapel Hill (UNC) and the Infectious Diseases Research Collaboration (IDRC) in Uganda. The work leveraged biological samples collected through ongoing, health facility-based molecular and parasitological malaria surveillance activities in Uganda, together with archived samples from prior studies. Surveillance activities were led by Ugandan investigators and conducted at up to 16 public health facilities across eastern and northern Uganda, selected based on established clinical and laboratory infrastructure.
Ugandan study team members played central roles in conducting the study and led key components of the work in collaboration with UCSF investigators, including participant enrollment, sample collection, ex vivo drug susceptibility assays and targeted sequencing using molecular inversion probes developed by the Brown University team and Sanger methods. WGS was performed at UNC, and downstream genomic and statistical analyses were conducted by the Brown University team. Targeted ONT long-read sequencing of historical samples was jointly planned and led by Brown University and UCSF investigators. All collaborating institutions jointly agreed on data ownership, intellectual property and authorship in advance of the research.
All studies were conducted in accordance with local and international ethical standards. Samples were collected under approved protocols with informed consent, including consent for future use of biological specimens. Genomic and phenotypic data were analyzed in de-identified form, with access restricted to authorized study personnel. The use of archived and prospectively collected samples was designed to maximize scientific value while minimizing additional risk to participants, and no new human participant recruitment was undertaken specifically for the genomic analyses reported here.
Findings from previous studies conducted in the same regions were used to inform sample selection for WGS and to contextualize the impact of the px1 haplotype identified in this work. Relevant prior studies are cited accordingly.
Ethics
For all the molecular and parasitological studies, consent for future use of biological samples was given for all samples and ethical approval was obtained from the Makerere University Research and Ethics Committee, the Uganda National Council for Science and Technology, and the University of California, San Francisco, Human Research Protection Program (approval numbers: 24-41284, SBS-2023-497, HS4481ES, 16-19084 and 10-03144).
Reporting summary
Further information on research design is available in the Nature Portfolio Reporting Summary linked to this article.



