
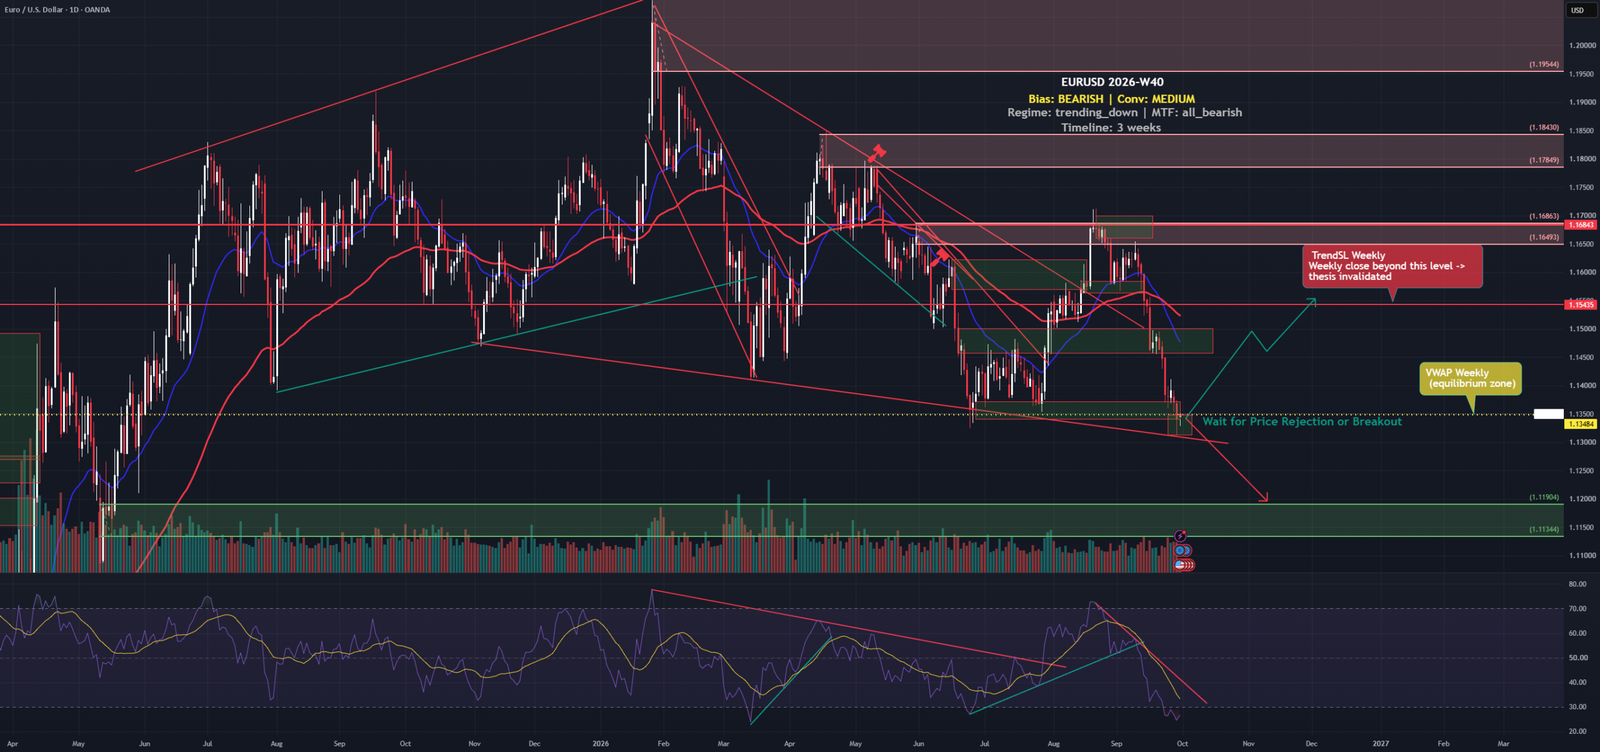
**Reference data** | week 2026-W40
– Symbol: EURUSD
– Week: 2026-W40
– Bias: bearish
– Conviction: medium
– Market regime: established downtrend
– Strategy context: trend-following
– Multi-timeframe structure: bearish across all tracked timeframes
– VWAP weekly: 1.13484
– TrendSL weekly: 1.15435
– Thesis snapshot close: 1.13385
– Current market price: 1.134 (as of 2026-09-30T05:53:00+00:00; source mt5:EURUSD.sml:1m)
– US 10Y yield: 5.24%
– US 2Y yield: 4.92%
– US 10Y real yield: 2.9%
– DXY directional read: bearish, low conviction
## L0 – Regime Identification
The immediate news backdrop sets a clear tone: Reuters reported that the US dollar was set for a large September gain, with the euro absorbing the bulk of that pressure. That confirmation did not arrive in isolation. New York Fed President John Williams stated that one further upward adjustment in the federal funds rate may be appropriate this year, and separately noted expectations for unemployment declining toward 4% alongside economic growth running near 2.5%. St. Louis Fed President Alberto Musalem added that roughly half of the inflation overshoot originated from supply shocks, implying that the remaining half is more structural and harder to dislodge through time alone. Together, these comments signal that the Fed has no near-term reason to pivot, and that rate pressure on the euro is not fading on its own.
The market is in an established downtrend, with a 0.70 regime confidence reading and bearish alignment across all observed timeframes. Compared to the prior week’s setup, nothing structural has broken that alignment — price remains below both the weekly VWAP at 1.13484 and the weekly TrendSL at 1.15435, holding within the bearish drift channel rather than testing its boundaries with any upside momentum.
## L1 – Driver Stack
The bearish case rests on macro forces, while shorter-term signals argue the other direction — and that conflict is the most important thing to hold in mind before reading any of the individual factors.
-> **Strongest driver — ECB vs Fed rate differential (macro bearish, +1.80):** The rate differential measures the gap between what you earn holding dollars versus euros. With the Fed signaling a potential additional hike while the ECB faces a weaker growth backdrop, that gap is widening in the dollar’s favor. A wider rate differential mechanically pulls capital toward the higher-yielding currency, which in this case is USD, creating persistent headwind for EURUSD.
-> **Real yield at 2.9% reinforcing USD demand:** The 10Y real yield — nominal yield minus expected inflation — sits at 2.9%. A high real yield means investors receive a genuinely inflation-adjusted return for holding US Treasuries, which attracts international capital and supports dollar demand independent of risk sentiment.
-> **Retail positioning contrarian lean (bearish context):** 72% of retail accounts tracked by FXSSI as of September 30 are net long EURUSD. Retail crowd positioning at extremes tends to precede moves against the crowd — when retail is this heavily loaded to one side, the market often finds fuel for the opposite move as those positions eventually stop out. This is contrarian context only, not a calibrated signal, and FXSSI samples broker clients rather than the full FX market.
-> **MTF alignment fully bearish:** All observed timeframes pointing the same direction reduces the noise around entries and suggests the path of least resistance remains lower.
-> **COT positioning (bullish +0.80, partial offset):** COT data suggests some institutional positioning with a bullish lean. Worth noting: the available source does not specify the report week, release date, or net-position figure, so this should be read as directional context rather than a precisely citable statistic. Its practical effect here is to reduce clean consensus — the macro is bearish but institutional positioning is not fully aligned with that view.
-> **Price action (bullish +2.50, the sharpest conflict):** The single largest signal conflict in the stack. Near-term price behavior has shown bullish momentum despite the macro backdrop. This is what separates a clean trending setup from the more complex situation currently present.
## L2 – Macro Snapshot
The yield structure tells a story that runs directly against easy monetary conditions. The 10Y Treasury yield stands at 5.24%, the 2Y at 4.92%, and the 10Y real yield at 2.9% — levels that represent genuine competition for global capital. When real yields are this elevated, the opportunity cost of holding euros or euro-denominated assets rises, because the alternative (US Treasuries) now offers a meaningful inflation-adjusted return.
Fed officials have been deliberate in not signaling relief. Williams’s comment about one additional rate adjustment reinforces that the Fed funds rate trajectory remains tilted upward, at least marginally. Musalem’s characterization of inflation as partly structural — not purely a supply-shock artifact — matters because supply-driven inflation tends to resolve itself, while demand or wage-driven inflation often requires sustained rate pressure to contain. If roughly half the overshoot is structural, the Fed is unlikely to ease until that half is convincingly tamed.
On the liquidity side, the Fed’s balance sheet proxy (Fed assets minus TGA minus overnight reverse repo) stood at $5,799.9B as of September 23, up $29.2B over four weeks. The TGA itself sits at $947.3B, down 1.26% over four weeks. A declining TGA means Treasury is spending down its cash at the Fed, which releases reserves into the banking system and can provide modest short-term liquidity support. But the SOFR-IORB spread at exactly 0 basis points on September 28 signals that funding markets are calm and orderly — no stress-driven demand for dollars that would independently move EURUSD. These liquidity metrics set the plumbing context; they do not by themselves change the directional bias.
VIX at 16.04 as of September 29 sits in a range consistent with normal expected equity volatility — not a risk-off spike that would typically trigger a flight-to-dollar trade, but also not complacency-level low. The CNN Fear and Greed reading of 32/100 reflects caution in US equities, though this measures equity sentiment rather than FX positioning directly.
## L3 – Technical Structure
As of Wednesday, September 30, 2026 at 05:53 UTC, EURUSD is quoted at 1.134 (source: mt5:EURUSD.sml:1m, near-realtime). The thesis snapshot close for reference context was 1.13385.
The key structural fact: price at 1.134 is testing the weekly VWAP of 1.13484 from underneath, sitting 0.00084 below it. The weekly VWAP — which tracks the volume-weighted average price over the week — acts as a dynamic battleground. Price pressing against it from below means sellers have broadly controlled the week’s distribution. A sustained move above VWAP would shift short-term momentum against the thesis; the current configuration does not yet show that.
The weekly TrendSL sits at 1.15435 — price is 0.02035 below that level. The TrendSL functions as the structural trend stop line: while price remains below it, the downtrend framework remains intact. That is a meaningful buffer from current levels.
The historical thesis close at 1.13385 versus the current 1.134 shows price is essentially flat relative to where the thesis was anchored, reinforcing that no decisive resolution has occurred either way.
## L4 – Intermarket Cross-Check
DXY as of September 30 at 05:43 UTC is quoted at 101.377 (source: yfinance:DX-Y.NYB:1m). The thesis snapshot for DXY context was 101.183, meaning the dollar index has nudged higher since the thesis was written, consistent with the Reuters report of a significant September gain.
Here is where the cross-check gets complicated: DXY carries a bearish bias of its own — but with low conviction. A dollar index that is bearish with low conviction while EURUSD is bearish with medium conviction creates a structural puzzle. EURUSD is approximately 57% of DXY by weight, so a falling EURUSD would ordinarily support a rising DXY. If both are assessed as likely to fall, the implication is that other USD pairs (particularly those involving JPY, GBP, CHF, or CAD) may be doing more of the dollar-strength work, or that the DXY assessment reflects cross-currents not captured by the EURUSD bilateral view alone. The practical implication: the DXY reading does not confirm a clean dollar bull environment, which is part of why conviction on EURUSD is medium rather than high. Traders watching DXY for corroboration will find a mixed signal there, not a green light.
## L5 – Event Risk
All dates below come from ForexFactory calendar data — this is an aggregator source, not an official institutional release confirmation.
-> Core PCE Price Index m/m — September 30, 2026: The Fed’s preferred inflation gauge. A hotter-than-expected print would reinforce the hawkish case and the rate differential argument; a soft print would briefly complicate it, though one data point is unlikely to change Fed communication given Williams’s recent guidance.
-> Final GDP q/q — September 30, 2026: Final revisions rarely surprise, but a meaningful upward revision to growth would further undercut the case for any near-term easing narrative.
-> Average Hourly Earnings m/m, Non-Farm Employment Change, Unemployment Rate — all October 2, 2026: The payrolls cluster is the event most capable of shifting short-term momentum sharply. Williams specifically referenced expectations for unemployment declining toward 4% — a payrolls beat that pushes unemployment lower would validate that view and extend the dollar-supportive narrative.
| Scenario | Probability |
|—|—|
| PCE beats + NFP beats: rate differential widens further, EURUSD pressure intensifies | Moderate |
| PCE in-line + NFP in-line: thesis holds, range-bound action near current levels | Moderate |
| PCE miss + NFP miss: short-term relief rally for EURUSD, tests VWAP 1.13484 more aggressively | Lower |
| NFP shock (large miss or large beat): potential for volatile intra-day reversals, reduced directional clarity | Tail risk |
## L6 – Conviction Scorecard
The overall bias is bearish with medium conviction. That medium rating is not a soft version of bearish — it is a direct reflection of the conflict within the signal stack. The macro framework and regime identification point clearly lower, but price action and institutional positioning data do not align cleanly with that view. Medium conviction means the framework sees the asymmetry as bearish but acknowledges enough friction that the setup does not have the kind of one-sided clarity that would warrant full sizing. The DXY assessment at low conviction for its own bearish view adds another layer of ambiguity at the intermarket level.
## L7 – Time Horizon
**Near-term (days):** The immediate focus is the event cluster on September 30 and October 2. Price is testing the weekly VWAP from underneath. Resolution of the PCE and payrolls data will likely determine whether price breaks that VWAP or continues to hold below it. Until that resolution, the technical picture is at a decision point rather than in clean trend mode.
**Timeline / mid-horizon (approximately 3 weeks):** This is the primary window the thesis operates within. The rate differential story is not likely to change materially within three weeks unless the Fed dramatically reverses tone. The trending-down regime, if it persists, would be expected to gradually press price toward lower supports over this period. The meaningful buffer below the weekly TrendSL at 1.15435 suggests the trend is not at risk of structural reversal unless something significant forces a recalibration.
**Medium-term (beyond the thesis window):** Beyond three weeks, the thesis defers to incoming data. If the Fed does implement another rate increase, the rate differential story extends further. If European data begins to surprise to the upside or ECB communication firms up, the foundation of the bearish case weakens. No medium-term call is extended here beyond acknowledging the macro dynamics that would need to shift.
## L8 – Invalidation Conditions
-> [NOT YET MET] A weekly close above the TrendSL weekly at 1.15435 would represent full structural invalidation of the bearish setup — this is the line at which the entire downtrend framework loses its footing. Traders not currently positioned should treat a sustained close above this level as the condition that removes the bearish premise from consideration. Traders already holding exposure should measure their own risk tolerance against this level when making reassessment decisions.
-> [NOT YET MET] If price sustains a move above the weekly VWAP at 1.13484 — currently being tested from underneath — that shift would signal short-term momentum moving against the thesis. Note that a brief pierce is not the same as sustained acceptance; price would need to hold above that level across multiple sessions to constitute a meaningful momentum shift rather than a temporary probe.
A note on the trader trap that this setup contains: reading the direction correctly does not protect against getting the timing wrong. The two major data events on September 30 and October 2 create a window where a temporary relief move — particularly on softer-than-expected PCE or payrolls data — could look like a directional reversal before the macro narrative reasserts itself. Traders who are not yet positioned should wait for the event cluster to resolve and for price to demonstrate post-event behavior before treating the setup as confirmed. The risk is not in misreading the macro; it is in entering on the basis of the macro story before the market has actually expressed that story in price. Being directionally right but early during a high-impact event window is a common and costly mistake — the VWAP at 1.13484 being tested right now is exactly the kind of zone where that trap springs.
—
*This analysis is for informational and educational purposes only and does not constitute financial advice.*
#EURUSD #ForexTrading #FXAnalysis #DollarStrength #FedPolicy #RateDifferential #TechnicalAnalysis #MacroTrading #VWAP #TrendFollowing #NFP #CorePCE #DXY #CurrencyMarkets #FXWeeklyOutlook



