
📊 The “Gambling Principle” in Nasdaq Trading — Why It’s Actually About Risk, Timing & Position Management
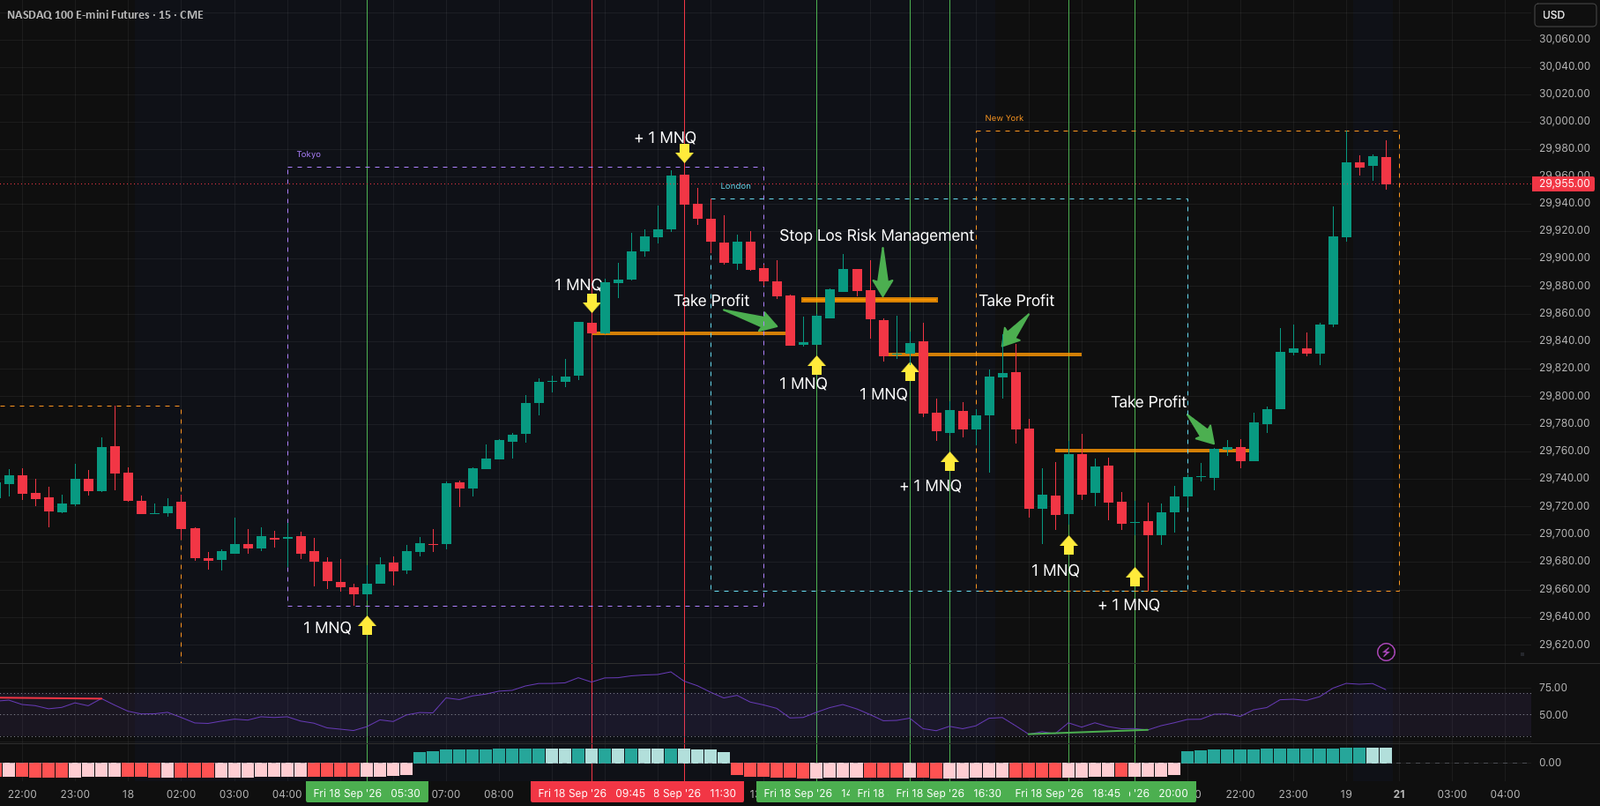
At first glance, this chart probably looks complicated.
Multiple sessions.
Entry markers.
Position increases.
Take-profit levels.
RSI.
MACD.
Session boundaries.
Risk-management decisions.
And to be fair, if you have never worked with this type of trading framework before, you may look at the chart and have absolutely no idea what is happening.
But underneath all those markings is a surprisingly simple idea:
Start small. Read the market. Increase exposure only when conditions justify it. Protect capital when they don’t.
That is the foundation of the strategy shown here.
🎲 Why I Call It the “Gambling Principle”
The name is intentionally provocative.
But this is not about randomly gambling on the Nasdaq.
The comparison comes from one specific idea: instead of immediately committing your full intended position, you begin with very small exposure.
For example:
1 MNQ → confirmation → potentially add another MNQ → manage the combined position
The first contract gives you exposure while keeping the initial commitment relatively small.
If the market confirms the scenario, the trader can consider increasing the position.
If the market invalidates the idea, the priority changes immediately:
Protect the account. Control the loss. Wait for the next opportunity.
That distinction is crucial.
Randomly adding contracts to a losing position because you “believe it has to come back” is not sophisticated position management. It can become uncontrolled averaging down.
A structured scale-in requires predefined conditions for when you may add, when you may not add, and when the entire idea is invalidated.
⏰ Sessions Matter More Than Many Traders Realize
One of the most important elements on this chart is not an indicator.
It is time.
The chart separates the major trading sessions, including Tokyo, London and New York.
Different sessions can produce very different behavior in Nasdaq futures.
Liquidity changes. Volatility changes. Participation changes. Previous session highs and lows can become important reference areas.
This means the same RSI reading or MACD signal can have very different meaning depending on where and when it occurs.
A signal appearing during quiet conditions should not automatically be treated the same as a signal developing around a major session transition or during an expansion in volatility.
That is why experienced trading becomes less about:
“The indicator says buy.”
And more about:
“What is the market doing, where are we in the session, and does the indicator confirm what price is already telling me?”
📈 RSI and MACD Are Context — Not Buttons
RSI and MACD are extremely useful tools when they are understood correctly.
The mistake is expecting them to predict every reversal.
An RSI reaching an extreme does not automatically mean price must reverse.
A MACD change does not automatically mean you should enter.
Instead, these indicators can help evaluate momentum, exhaustion, acceleration and changes in market conditions.
Look at the chart as a combination of information:
Price structure + session timing + momentum + RSI + MACD + position management.
No single component has to make the decision by itself.
The value comes from combining them.
🧠 The First Contract Is About Information
This is where the strategy becomes more interesting.
Imagine you identify a potential setup and enter with 1 MNQ contract.
You are not immediately trying to maximize the trade.
You are testing your thesis with controlled exposure.
Now price starts behaving as expected.
Structure confirms.
Momentum confirms.
The session context makes sense.
Instead of having entered your entire intended position at the beginning, you still have the ability to adapt.
You may now decide to increase the position.
That creates a fundamentally different mindset:
You are adding because the market is giving you more information — not because you are trying to rescue a bad trade.
Those two situations should never be confused.
🛡️ Adding Size Is Where Risk Management Becomes Critical
Increasing from one contract to two contracts sounds simple.
But your risk has changed.
That means your risk-management decision may also need to change.
Suppose the first entry develops favorably and you later add another MNQ contract.
At that point you need to think about the position as a whole:
Where is the average entry?
How much open profit exists?
Where is the thesis invalidated?
How much of that open profit are you willing to give back?
Should the first contract now be protected?
Should part of the position be taken off?
This is why scaling into a trade should never mean blindly increasing leverage.
The objective is not:
“How big can I make this trade?”
It is:
“How can I increase exposure while keeping total account risk under control?”
🧠 What About Trading Without a Fixed Stop-Loss?
This is probably the most misunderstood part of the entire approach.
Some experienced traders manage certain positions using a mental stop rather than immediately placing a fixed stop order in the market.
But that does not mean:
“There is no stop-loss.”
It means the exit threshold is managed by the trader rather than resting as an order at the broker or exchange.
The trader still needs a clearly defined point at which the thesis is wrong.
For example:
“If price loses this structure and fails to recover it, I exit.”
That is fundamentally different from:
“I’ll just wait and see what happens.”
The second approach has no real risk framework.
⚠️ A Mental Stop Is an Advanced Risk-Management Technique
There is an important downside that should not be ignored.
A fixed stop order can execute automatically.
A mental stop cannot.
During a fast Nasdaq move, price can travel quickly. A trader can hesitate. The platform can disconnect. Volatility can suddenly expand.
That means a mental stop introduces execution and behavioral risk that a resting protective order can reduce.
For many traders — particularly beginners — a predefined stop order may therefore be the more appropriate way to control downside.
Using a mental stop responsibly requires discipline, continuous attention and a predetermined maximum loss.
No visible stop order should never mean unlimited risk.
💰 Take Profit Is Part of Risk Management Too
The green arrows and orange levels on the chart represent another important concept:
Risk management does not end once a position becomes profitable.
Taking partial profits can reduce exposure.
Protecting the remaining position can change the risk profile.
And sometimes the correct decision is simply to take the trade off rather than trying to squeeze every possible point from the move.
You don’t need to catch the entire Nasdaq move.
You need a process that can be repeated.
🔄 Think in Sequences, Not Individual Trades
The chart becomes much easier to understand once you stop looking at every arrow as an isolated trade.
Instead, think of the process as a sequence:
Session → Structure → Momentum → Initial Position → Confirmation → Position Adjustment → Risk Adjustment → Profit Management → Exit
And then the process starts again.
This is why the chart looks complicated while the underlying framework is actually systematic.
The arrows themselves aren’t the strategy.
The decisions between the arrows are the strategy.
🏦 Where Prop-Firm Trading Changes the Equation
This type of position-management framework can also be relevant when trading within a proprietary trading firm’s rules, because the trader may have additional constraints such as maximum loss, daily loss limits, position-size limits or consistency requirements.
Those rules should be treated as part of the strategy itself.
A technically good trade can still be inappropriate if its position sizing or downside violates the account’s risk parameters.
And prop-firm rules vary significantly, so they need to be understood before applying any scaling strategy.
🎓 Why This Is an Advanced Concept
This is not the type of setup I would recommend someone copy after looking at one screenshot.
There are several concepts interacting simultaneously:
Sessions. Market structure. Position sizing. Scaling. RSI. MACD. Momentum. Profit taking. Stop management. Account risk.
Understanding each component individually is relatively easy.
Understanding how they interact in real time is where trading becomes considerably more advanced.
This is also the type of framework we work through at an advanced level: not simply finding entries, but understanding how a position can be built, protected, adjusted and eventually closed as new market information becomes available.
Because eventually the question stops being:
“Where should I enter?”
And becomes:
“How should I manage the trade after I enter?”
That is a much more important question.
🎯 Final Thought
The chart may look complicated.
But its central principle is simple:
Start small.
Let the market provide information.
Increase exposure only when your framework allows it.
Protect capital when the thesis weakens.
Understand the session you’re trading.
Use indicators as confirmation rather than prediction.
And whether your risk is managed through a resting stop order or, for an experienced trader, a carefully defined mental exit:
Always know where the trade is wrong before you worry about how much it could make.
That is not gambling.
That is structured risk management.
This analysis is for educational and informational purposes only and does not constitute financial or investment advice. Futures trading and leveraged products involve substantial risk. Mental stops may fail to limit losses during rapid price moves, execution delays or loss of connectivity. Always use position sizing and risk controls appropriate to your experience and account.



