
LBC1936
Cognitive data and brain samples were obtained from LBC1936 (Medical Research Council Brain Bank, The University of Edinburgh), with ethics permission from the Multi-Centre Research Ethics Committee for Scotland (MREC/01/0/56), the Lothian Research Ethics Committee (LREC/2003/2/29) and the Scotland A Research Ethics Committee (07/MRE00/58). Participants are Scottish, of majority white European ancestry and include both sexes (gender data not requested). Clinical history and neuropathological examinations were provided by C. Smith (The University of Edinburgh). The use of LBC samples was in accordance with the terms of use for donor tissue and information.
Cognitive testing
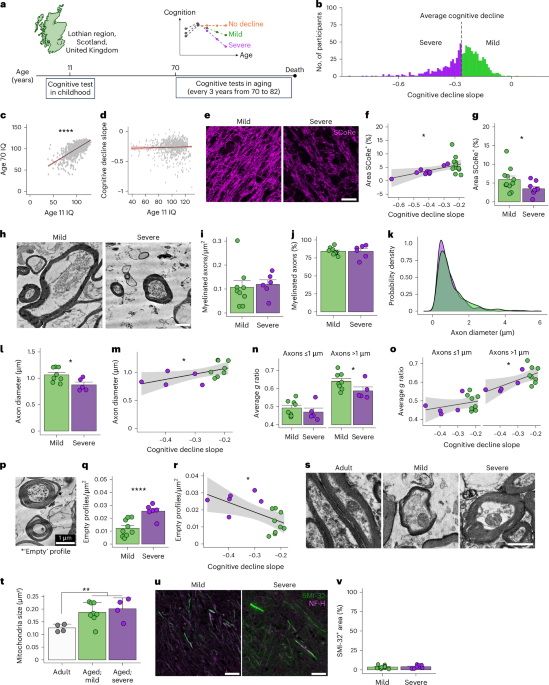
In 1947, participants of mean age 11 years underwent a group-administered 45-minute general intelligence test (Moray House Test (MHT) No. 12), which indicated concurrent validity with the standardized Stanford−Binet test of intelligence (R = 0.8)90. Individuals consented to re-testing at age 70 onwards13; of 1,091 participants, 1,017 had viable age 11 and age 70 test scores, enabling correlation between IQ in childhood and aging. In total, 866 participated beyond wave 1, of whom 816 had viable age 11 test scores, enabling correlation between cognitive decline in aging and age 11 IQ. Data from waves 1−5 were used in this study, where standardized cognitive tests were administered at each wave (approximately every 3 years), in addition to the MHT (No. 12) (Fig. 1a and Extended Data Fig. 1a). Of these, 10 tests were input to a latent growth curve model in a structural equation modeling framework to indicate latent general cognitive ability14,15,16, including matrix reasoning, block design, digit−symbol match and symbol search (Weschler Adult Intelligence Scale III); logical memory, digit span, verbal paired associates and digit backwards test (Weschler Memory Scale III); choice reaction time (UK Health and Lifestyle Survey); and inspection test (constructed using E-Prime software). Raw test results were scaled so that variances were in similar ranges across tests. Growth curve models for individual tests were specified and fit to the data using the lavaan (version 0.6.21), haven (version 2.5.5) and psych (version 2.6.5) packages in R (version 4.4.2), with slope weightings as the mean test interval (years) and using full information maximum likelihood estimation. A hierarchical model was fit in which cognitive test scores were assigned to cognitive domains (Extended Data Fig. 1a), and high correlations between domains were modeled as a hierarchical general cognitive factor (g)14,15,16, showing excellent fit to the data (Tucker−Lewis index (TLI) of 0.945, comparative fit index (CFI) of 0.946, standardized root mean square residual (SRMR) of 0.066 and root mean square error of approximation (RMSEA) of 0.033). Intercept and slope scores were extracted for each individual using the lavPredict function (lavaan package, version 0.6.21); the intercept represented g at age 70, and the slope represented annual decline from 70 to 82 years. All but one individual showed a negative rate of change in g (Sg < 0) beyond age 70, with the average decline per year being −0.26 s.d. g units. Trajectories declining more steeply than this average (that is, Sg < −0.26) were classed as ‘severe’, whereas those above average were classed as ‘mild’.
Human brain tissue
Brain tissue was collected from a subset of consenting individuals91. Postmortem intervals ranged between 1 day and 4 days, during which cadavers were stored at 4−6 °C92. LBC1936 samples (79−85 years) and adult samples (34−49 years) were acquired from the LBC tissue bank or the Sudden Death Brain Bank under the Medical Research Council Edinburgh Brain and Tissue Bank (21/ES/0097) and approved by local ethical review boards in Edinburgh and at Unity Health Toronto (REB 23-088). For LBC1936, one hemisphere was drop fixed into 10% (w/v) formalin fixative for paraffin embedding and histochemistry, and the remaining hemisphere was sliced into 1-cm-thick coronal sections; 1-cm3 regions of interest were collected as tissue punches91 and processed for electron microscopy. Adjacent samples were snap frozen for transcriptomic analyses.
Electron microscopy of human white matter
Fresh human postmortem brain tissue (1 cm3)91 was placed in 0.1 M phosphate buffer. Tissue was dissected (1 × 1 mm3) and fixed for 48 hours in 4% paraformaldehyde (PFA; Electron Microscopy Sciences, cat. no. 15710) and 2.5% (w/v) glutaraldehyde (Electron Microscopy Sciences, cat. no. 16310) in 0.1 M electron microscopy-grade phosphate buffer (pH 7.4) at 4 °C and then washed and stored in 0.1 M phosphate buffer for a minimum of 24 hours92. Samples were incubated in 1% (w/v) osmium tetroxide (Electron Microscopy Sciences, cat. no. 19152) in 0.1 M phosphate buffer for 30 minutes at room temperature, washed in 0.1 M phosphate buffer and then ddH20 and dehydrated in graded ethanols, finishing in propylene oxide (Sigma-Aldrich, cat. no.56671-5ML-F). Sections were embedded in durcupan resin (Sigma-Aldrich, cat. no.44610-1EA) for 24 hours and polymerized for 48 hours at 56 °C. Ultra-thin sections (50 nm) were cut on an ultra-microtome (Leica, EM UC7) and stained with uranyl acetate and lead citrate, and grids were imaged on a JEOL JEM 1400 Plus transmission electron microscope. A minimum of 100 myelinated axons were traced for axon diameter and myelin thickness using Fiji ImageJ, assuming circularity (axon diameter = 2 × sqrt(axon area / Π)). Myelin thickness (g ratio) was calculated by (inner axon diameter / outer myelinated axon diameter). Large-diameter axons were categorized as being >1 µm, at which myelin is thickest under homeostasis93 and more vulnerable to increased thickness in disease37. Myelinated axons were quantified in an average area of 1,500 µm2. Mitochondrial area was measured from a minimum of 100 myelinated axons per donor and traced using the polygon tracing tool (Fiji ImageJ). Degenerating axons were defined as lacking visible pallor with intensities equivalent to cytoplasmic space. Seventeen lateral corpus callosum samples were available for electron microscopy analysis; due to poor tissue quality, two cases were excluded from myelinated axon density and four from myelin thickness analysis. Investigators were blinded to case history and cognitive trajectories throughout analysis.
snRNA-seq
A pilot study optimized retrieval of high-quality nuclei for sequencing (Extended Data Fig. 2a−f), testing a previously established protocol (1)30,31, including twice the input material (2) or using FANS to isolate nuclei and exclude myelin debris (3). Fresh-frozen human tissue sections (20 µm) were cut at −20 °C and placed into ultra-low binding Eppendorf tubes on ice. Either five sections (protocols 1 and 3) or 10 sections (protocol 2) of 1 × 1 cm3 were utilized. Then, 200 µl of lysis buffer (1,700 µl of PURE buffer (Sigma-Aldrich, NUC-201-1KT), 17 µl of 0.1 M DTT (Thermo Fisher Scientific, cat. no. 15846582), 17 µl of 10% Triton-X (BioShop Canada, cat. no. TRX777.100) and 34 µl of SUPER RNAse inhibitor (Thermo Fisher Scientific, cat. no. AM2696)) was added to each tube and tissue homogenized on ice with needles of ascending gauge until a smooth consistency was achieved. Lysates were mixed with 360 µl of sucrose cushion medium (PURE 5 M sucrose solution (Sigma-Aldrich, NUC-201-1KT)) containing 11% PURE sucrose cushion buffer (Sigma-Aldrich, NUC-201-1KT), 0.11% DTT (Thermo Fisher Scientific, cat. no. 15846582) and 0.02% RNAse inhibitors (Thermo Fisher Scientific, cat. no. AM2696) and then passed through a 30-µm strainer (Wolf Laboratories, 04-004-2326). The filtrate was gently plated on 200 µl of the sucrose cushion medium, and samples were centrifuged for 45 minutes at 16,100g at 4 °C. The pellet was resuspended in 100 µl of elution buffer, which, for protocols 1 and 2, constituted 7 ml of PURE storage buffer (Sigma-Aldrich, NUC-201-1KT) containing 70 µl of RNAse inhibitor (Thermo Fisher Scientific, cat. no. AM2696) and, for protocol 3, constituted sterile PBS (Thermo Fisher Scientific, cat. no. BP399-20) with 1% fatty-acid-free BSA (Sigma-Aldrich, cat. no. A8806-1G), 2 mM EDTA and 1% RNAse inhibitor (Thermo Fisher Scientific, cat. no. AM2696). Resuspended samples were moved into a fresh tube, centrifuged for 5 minutes at 1,000g at 4 °C and pellet resuspended in 200 µl of elution buffer. DAPI (1:1,000) was added in to protocol 3. Samples were centrifuged for 5 minutes at 1,000g at 4 °C and resuspended in 50−150 µl of elution buffer. For protocols 1 and 2, nuclei were counted by mixing with trypan blue (1:1) using the Bio-Rad Cell Counter TC200. Nuclei concentration was standardized to 100,000 nuclei per milliliter using the elution solution and processed for snRNA-seq. Protocol 3 was FAN-sorted using a BD FACSAria II cytometer running BD FACSDiva software (version 8.0.1), gating on DAPI+ nuclei; 60,000 events were captured into elution solution, the sample centrifuged at 750g for 5 minutes, pellets resuspended in 50 µl of elution solution and standardized to 100,000 nuclei per milliliter. As sorting nuclei provided the best results, protocol 3 was utilized when running the LBC samples as singular cases. Eight cases were processed as separate samples per day, with 2 days of processing (total 16 cases), filling a 10x Genomics Chromium Single Cell 3′ chip. Best efforts were taken to balance each batch for sex, age and degree of cognitive decline. In total, 52,000−60,000 nuclei were collected per case during the FANS step, with final 10× loading of 20,000 nuclei per case.
Library preparation and next-generation whole-transcriptome sequencing
Approximately 20,000 nuclei per sample were loaded onto a 10x Genomics Chromium Single Cell 3′ chip. Then, 10x Genomics v3 beads, gel beads-in-emulsion (GEM) kits and library kits were used as per the manufacturer’s instructions to generate Chromium Single Cell 3′ Gene Expression (GEX) libraries. Library concentrations and quality were tested with an Agilent TapeStation (HS D5000). Two of 16 samples had cDNA libraries with a concentration lower than 6 ng µl−1 and were, therefore, of poor quality; all other samples had libraries between 6.37 ng µl−1 and 13.8 ng µl−1. Libraries were assessed for size distribution on the Agilent Bioanalyzer (Agilent Technologies, G2939AA) with the DNA HS Kit (5067-4626) and quantified using the Qubit 2.0 Fluorometer (Thermo Fisher Scientific, Q32866) and the Qubit dsDNA HS assay kit (Q32851). Library molarity for sequencing was calculated using the Qubit dsDNA quantification results and the fragment size information from the Bioanalyzer results. Sequencing was performed on the NextSeq 2000 platform (Illumina, SY-415-1002) using the NextSeq 1000/2000 P3 Reagents (100 cycles) v3 kit (20040559). Libraries were pooled in equimolar quantities, and PhiX Control v3 (FC-110-3001) library was spiked into the three runs at a concentration of approximately 1% to help with cluster resolution and facilitate troubleshooting. All 16 libraries were initially run on one P3 flow cell, and resulting nuclei quality was confirmed. Two of 16 samples with significantly lower nuclei counts were flagged as having poor library quality and removed from further analysis. The remaining 14 libraries were sequenced on an additional two P3 flow cells. The three flow cells generated 180 GB per run (approximately 540 GB total) with approximately 80% of clusters passing filter during sequencing and 93% of the data in each run being >Q30. Base call data (generated by NextSeq 1000/2000 Control Software version 1.5.0.42699) were transferred to a computer running Ubuntu (version 20.04.2 LTS), and Cell Ranger (version 7.1.0) generated FASTQ files via demultiplexing raw base call files. FASTQ files were demultiplexed and aligned to the human reference genome GRCh38 using 10x Genomics’ Cell Ranger pipeline (version 7.1.0) on a high-performance computing cluster. Prior to any quality control, 46,988 nuclei were retrieved with an average of 2,715 genes per nucleus, 7,750 UMIs per nucleus and an average mitochondrial percentage per nucleus of 2.22%. The quality of nuclei retrieved did not significantly differ across samples (Extended Data Fig. 2g−i).
snRNA-seq analysis
Filtered feature matrices resulting from the alignment of each sample with Cell Ranger (version 7.1.0) were read into R (version 4.4.2) using the Read10X function (Seurat package, version 5.2.1), and Seurat objects for each sample were created with the CreateSeuratObject (SeuratObject package, version 5.1.0). Each Seurat object was visually inspected for number of features, counts and mitochondrial gene percentages. Filtering thresholds across Seurat objects were chosen such that only nuclei with a feature number between 200 and 7,500 and mitochondrial gene percentages less than 10% were included, as recommended for human nuclei94. No nucleus had a UMI less than the recommended cutoff of 500, with the average UMI count per nucleus being 7,750 before filtering. After quality control filtering, we retained 45,437 nuclei, with an average of 2,740 genes and 7,705 UMIs per nucleus. Seurat objects were normalized, and the 2,000 most variably expressed features across objects were selected as integration anchors to combine the samples into one Seurat object. The resulting integrated object was scaled, and linear dimensional reduction via principal component analysis (PCA) was performed. Elbow plots and JackStraw plots visualized the contributions of each principal component, and the top 11 were chosen as input to cluster the nuclei in a uniform manifold approximation and projection (UMAP) space. For primary cell type annotation, a resolution value of 0.01 was used.
Cell type annotation and subsetting
Canonical features of expected populations (PLP1, BCAS1 and ENPP6 for oligodendrocytes; GFAP, ALDH1A1 and AQP1 for astrocytes; PTPRC, CSF3R and DOCK8 for immune cells; PDGFRA, MMP16 and CSPG4 for oligodendrocyte precursor cells; SNAP25, GRIN1 and CHRM2 for neurons; and CLDN5, MYO1B and SLC38A11 for endothelial/vascular cells) were visualized in the combined UMAP by feature plots. Cell type identities were confirmed via inspection of top-expressed genes within each cluster. To analyze cell type subpopulations, we subset the combined Seurat object by each cell type cluster, and the resulting objects underwent scaling and linear dimensional reduction via PCA. An appropriate dimensionality of the data was chosen via inspection of the elbow plots. For all subset populations, a dimensionality of 8 was chosen for further processing. UMAPs were run with the input dimension set to 8, and single-nucleus neighbors and clusters were found via k-means clustering. Resolution was determined through trialing progressively higher resolutions for each cell type and inspecting subcluster separation (visualized via heatmaps of the top-expressed genes using Model-based Analytics of Single-cell Transcriptomics (MAST)) and alignment with known biological variation in cell types. Oligodendrocyte subclusters were well separated transcriptionally (Extended Data Fig. 3a), recapitulating the approximate number seen previously30,31,34,95, including in human33. The final resolutions used for each cell type subset were 0.2 for oligodendrocytes (seven clusters), 0.07 for oligodendrocyte precursor cells (three clusters), 0.1 for neurons (four clusters), 0.02 for astrocytes (three clusters), 0.2 for immune cells (seven clusters) and 0.05 for endothelial/vascular cells (four clusters) (Extended Data Fig. 3b).
Differential gene expression analysis
To analyze differential gene expression, pseudobulk count matrices of the sequencing data were generated using the limma and voom pipeline within the limma (version 3.56.2) and edgeR (version 3.42.4) packages in R (version 4.4.2). For each cell type, pseudobulk groups corresponding to cell type subclusters for each individual were defined. The pseudobulk count matrix was normalized to counts per million per gene and filtered such that only genes with at least one read in at least 80% of samples were retained. The library sizes were reset to reflect the refined dataset, and raw library sizes were converted into normalized effective library sizes via the calcNormFactors function in edgeR (version 3.42.4). Only clusters found in more than half of the sequenced cases were analyzed for DEGs, excluding four subpopulations (Neuron2, Astro2 and Immune 5/Immune6). To analyze DEGs in oligodendrocyte subclusters, contrast matrices were defined to compare each enriched subpopulation against all other oligodendrocyte subpopulations. These design matrices were used as input when readying count data for linear modeling using the voom function of the limma (version 3.56.2) package, and resulting voom plots were inspected to check that gene filtering thresholds were stringent enough to remove poorly predictive data. Voom output on the filtered dataset was fit to a linear model (lmFit function, ‘stats’ package (version 4.3.1)) adhering to the design matrix defined, and estimated coefficients were computed (contrasts.fit function, limma package (version 3.56.2)). Log-odds of differential expression were generated via empirical Bayes moderation of the standard errors toward a global value (eBayes function, limma package (version 3.56.2)). To analyze differential gene expression in cell type subclusters across cognitive decline scores, design matrices were generated that included cognitive decline slopes and the following covariates: absolute cognitive score at age 70, neuropathological indications of Alzheimer’s disease or small vessel disease, age, sex and size of the cluster per donor; this regressed out variability associated with biological processes distinct from the rate of cognitive decline, which drastically reduced the number of DEGs passing the threshold of adjusted P < 0.05.
Pathway analysis
Pathway analysis was implemented using IPA software. For analysis of Oligo4 and Oligo5 across the spectrum of cognitive decline, a filtration cutoff of P < 0.1 was applied in order to include a sufficient number of genes required for statistical confidence. Predicted upstream regulators were only considered for follow-up analysis if they were not included as chemical drugs or toxicants and had an ‘activated z-score’ (indicative of significant pathway activity) greater than absolute 2.
SCoRe imaging
SCoRe imaging was carried out using a Leica Stellaris 5 confocal microscope with an RT85/15 beamsplitter set to capture reflectance. Laser wavelengths were set to 488 nm, 561 nm and 638 nm, and detectors centered around these wavelengths at the minimum physical opening threshold of 5 nm. For the first image in each sample, laser power and gain were increased until the first positive saturated pixel was detected, and then image settings were fixed. For the human tissue, formalin-fixed paraffin-embedded (FFPE) sections were deparaffinized, and eight technical replicate images were taken with a ×63 oil objective (numerical aperture 1.4; HC PL APO CS2) at systematic random sampling intervals across the section. The readout from each channel was merged into one composite image and converted to an RGB 8-bit image, and then the percentage area of signal above threshold background was quantified using a fixed threshold (value 9, based on the average default threshold across the first three samples imaged) in Fiji ImageJ.
Immunofluorescent staining of human white matter
FFPE sections (6 µm) of lateral corpus callosum were dewaxed at 60 °C for a minimum of 2 hours and then rehydrated in xylene (2 × 10 minutes) and 5-minute incubations in ethanol (100%, 100%, 95%, 80%, 70%). Samples were microwaved in hot (approximately 95 °C) 0.1 M sodium citrate buffer (pH 6; Vector Laboratories, cat. no. H-3300-250, diluted in ddH2O) for 5−10 minutes, placed in a 60 °C oven for 30 minutes and then cooled at room temperature. Endogenous peroxidase and alkaline phosphatase blocking solution (Bloxall; Novus Biologicals, cat. no. Sp-6000-NB) was applied for 10 minutes, before a 1-hour block in 10% normal horse serum with 0.3% Tween 20 (Thermo Fisher Scientific, cat. no. BP337100) in 0.1 M TBS (Thermo Fisher Scientific, cat. no. BP24711). Primary antibodies were applied in a humid chamber overnight at room temperature. Tissue was washed (3 × 5 minutes in 0.1 M TBS), incubated for 1 hour with an HRP-conjugated secondary antibody (Vector Laboratories) and then washed again and incubated with a tyramide Opal-conjugated secondary antibody diluted in amplification diluent for 10 minutes (Akoya Biosciences, cat. no. FP1135). Tissue was washed, and Hoechst (1:1,000; Thermo Fisher Scientific, cat. no. H1399, lot 2936197) was added into the penultimate TBS wash. Sections were dried, mounted with Fluoromount G (Thermo Fisher Scientific, cat, no. 00-4958-02) and coverslipped (Thermo Fisher Scientific, cat. no. 12541033CA). For oligodendrocyte detection, a rabbit primary antibody against Olig2 (1:100; Sigma-Aldrich, cat. no. AB9610, RRID: AB_570666, lot 3857662), a secondary horse anti-rabbit HRP-ImmPress antibody (Vector Laboratories, cat. no. MP-7401, RRID: AB_2336529, lot ZK0830; used neat) and a tyramide Opal-570 fluorophore (1:100; Akoya Biosciences, cat. no. FP1488001KT, lot 231016009) were applied. For NRF2 and Olig2 double staining, mouse anti-Olig2 (1:100; Sigma-Aldrich, MABN50; lot 421151), horse anti-mouse HRP-ImmPress secondary antibody (Vector Laboratories, cat. no. MP-7402-15, lot ZL1001) and tyramide Opal-570 fluorophore (1:100; Akoya Biosciences, cat. no. FP1488001KT, lot 231016009) were applied first, followed by incubation with a rabbit primary against NRF2 (1:100; Abcam, cat. no. AB31163, RRID: AB_881705, lot 1030320-17) diluted in 10% normal horse serum and 0.3% Tween 20 (Thermo Fisher Scientific, cat. no. BP337100) in 0.1 M TBS overnight at room temperature and a 1.5-hour incubation in donkey anti-rabbit Alexa647-conjugated secondary antibody (1:200; Thermo Fisher Scientific, cat. no. A-31571, RRID: AB_162542, lot 3219281). For neuronal staining, mouse primary antibody against SMI-32 (1:500; BioLegend, cat. no. 801701, RRID: AB_2564642, lot B448462), horse anti-mouse HRP-ImmPress secondary antibody (Vector Laboratories, cat. no. VECTMP740215, lot ZL1001) and tyramide Opal-520 fluorophore (1:100; Akoya Biosciences, cat. no. FP1487001KT, lot 230919042) were applied, with all washes including 0.3% Tween 20. Sections were washed, and remaining tyramide signal amplification was heat stripped via hot citrate buffer. Slides were cooled, and then chicken primary antibody against neurofilament (1:500; BioLegend, cat. no. 822601) was incubated overnight at room temperature, followed by washing and 1.5-hour incubation with donkey anti-chicken Alexa647 secondary antibody (1:200; Thermo Fisher Scientific, cat. no. 78952, lot 2622383).
Immunofluorescent imaging and quantification of human white matter
Tile-scanned images across human FFPE sections were generated by a Zeiss AxioScan.Z1 slide scanner with a ×20 Plan Apochromat objective (numerical aperture 0.8). For Olig2 density analysis, the entirety of each FFPE section imaged was analyzed, corresponding to approximately 1.5 × 1.5 cm2 of tissue surveyed and a minimum of 62,000 nuclei per individual. Olig2+ cell densities were quantified using the cell detection application in QuPath (version 0.5.1). Thresholds were chosen (between 1,200 and 3,400 for Hoechst; between 2,700 and 4,700 for Olig2), which optimized the cell detection algorithm without losing positive cells or introducing background signal. Fixed thresholds were not applied across samples as these resulted in false-positive and false-negative detections. Autofluorescent blood vessels were manually traced and removed. For NRF2 and SMI-32 analyses, at least 3 × 1 mm2 randomly sampled technical replicate images were exported and analyzed with Fiji/ImageJ (Fiji.sc version 2.1.0/1.53c). For NRF2 analysis, NRF2+Olig2+ cells were manually quantified with the Cell Counter plugin in ImageJ. For SMI-32 analysis, any SMI-32+ cell body staining co-localizing with Hoechst was circled using the oval tool in Fiji and manually excluded to specifically assess axonal SMI-32. Fixed threshold analyses unreliably yielded false-positive and false-negative threshold detection across samples, so the automatic threshold detector in ImageJ was used to detect SMI-32 signal. For all stains, the average of technical replicates was used as one biological replicate. Case cognitive scores, sex, age and IQ values were blinded to the investigator during the analysis. Results were exported from QuPath/ImageJ and graphed using R (version 4.4.2).
Nfe2l2 oligodendrocyte-specific conditional knockout mice
Plp-CreERT mice96 on a C57BL/6J background (Popko laboratory, Northwestern University) were crossed with Nfe2l2fl/fl mice (The Jackson Laboratory, 025433)97 on a C57BL/6J background to obtain a tamoxifen-inducible conditional knockout mouse (Plp-CreERT;Nfe2l2fl/fl). Animals (both sexes) were housed in pathogen-free, temperature-controlled conditions (maintained at an ambient temperature of 20−24 °C and 25−50% humidity) in accordance with the guidelines set forth by the Northwestern University Institutional Animal Care and Use Committee. Animals had ad libitum access to food and water and were on a 12-hour per day light on/off cycle. At 6 months, animals were intraperitoneally injected with 1 mg d−1 4-hydroxy-tamoxifen (4-OHT; Sigma-Aldrich, H6278) diluted in sunflower oil for five consecutive days. At 12 months, animals underwent cognitive testing, first on the large open field (LOF) test and then the MWM. After cognitive testing, a subset of the 12-month-old animals were either intracardially perfused with 4% PFA (Thermo Fisher Scientific, cat. no. T353-500) and snap frozen in optimal cutting temperature (OCT) compound for immunofluorescence or intracardially perfused with 0.1 M cold PBS (Thermo Fisher Scientific, cat. no. BP399-20) followed by 4% PFA (Thermo Fisher Scientific, cat. no. T353-500) with 2.5% glutaraldehyde (Electron Microscopy Sciences, cat. no. 16220) in 0.1 M sodium cacodylate (Electron Microscopy Sciences, cat. no. 11652) for electron microscopy. Separate cohorts of Plp-CreERT;Nfe2l2fl/fl animals (which did not receive behavioral testing) were collected at 15 months and 18.5 months for immunohistochemistry and electron microscopy, respectively. Mice from both sexes were used at each timepoint; however, female mice showed genotype-specific differences in the LOF test (Extended Data Fig. 4a,b) and, thus, were excluded from further analysis.
RNAscope
RNAscope was performed using an RNAscope v2 Multiplex Fluorescence Kit (ACDBio, cat. no. 323136) with a probe against murine Nfe2l2 (ACDBio, cat. no. 475571), following the ACDBio protocol. Coronal sections from 12−15-month-old Plp-CreERT;Nfe2l2fl/fl and age-matched controls were thawed for 30−60 minutes at room temperature and then dehydrated by 5-minute incubations of increasing ethanol concentrations (50%, 70%, 95%, 100%). Hydrophobic barriers were drawn around tissue (ImmEdge barrier pen; ACDBio, cat. no. 323136), and sections were incubated in hydrogen peroxide for 10 minutes. Slides were placed in hot antigen retrieval buffer at 95 °C for 5 minutes and then cooled. Manual Pretreat Pro (RNAscope v2 Multiplex Fluorescence Kit; ACDBio, cat. no. 323136) was incubated at 40 °C for 30 minutes, and the Nfe2l2 probe was hybridized at 40 °C for 2 hours. Separate sections were hybridized for 3-plex positive (Pol2RA; PPIPB; UBC) or negative (DapB) control probes. A series of amplification probes (AMP1,2,3) were applied in 15−30-minute incubations, after which secondary antibodies were added (Akoya Biosciences, FP1496001KT). HRP blocker was added for 15 minutes at 40 °C, and tissue was incubated overnight with primary antibody against Olig2 (goat anti-Olig2 at 1:200; R&D Systems, cat. no. AF2418). Sections were washed, and donkey anti-goat Alexa568 secondary antibody (1:200; Thermo Fisher Scientific, cat. no. 11057) and Hoechst (1:10,000) were applied for 2 hours at room temperature before being washed and mounted.
Behavioral assays
Twelve-month-old (±10 days) male and female Plp-CreERT;Nfe2l2fl/fl and age-matched control mice were tested at the Northwestern University Behavioral Phenotyping Core. Mice were moved to the behavioral testing facilities 30 minutes prior to testing for habituation. Between active testing, animals had ab libitum access to water and food. A maximum of 25 animals per day were tested. Animals underwent testing on the LOF (54.6-cm2 arena) in a soundproof room under white light, with four animals tested simultaneously in four separate closets. Arenas of the LOF were defined as 18-cm2 squares at the center or corners of the arena. Animals were allowed to explore freely for 10 minutes. LimeLight5 software from Actimetrics recorded time spent in the center or corners. LOF arenas were cleaned with 70% ethanol between each animal. Female Plp-CreERT;Nfe2l2fl/fl animals showed significantly altered anxiety-like behavior and were, thus, excluded from further analysis. The MWM consisted of a circular water bath (diameter 1.5 m) filled with water and a non-toxic white dye that discolored the water, and was divided into four quadrants corresponding to ordinal directions (NE/SE/SW/NW) with visible cues (91.4 cm wide) on the wall at each direction of the maze (N/E/S/W). MWM testing took place over 9 days, consisting of a 3-day acclimatization phase, a 2-day rest period and then a 4-day testing phase. During acclimatization, a visible platform (20 × 3 × 25.4 cm) was submerged but identifiable via projecting pillars. On each day, animals were tested in two sessions, with four trials per session (total of eight trials per day per animal). In each trial, mice were allowed to navigate to the platform for up to 1 minute and removed upon successful navigation to the platform. If a mouse ceased swimming and floated on its back, the mouse was removed and the trial was ended. At the end of the trial, the platform changed location; the order of which quadrant the mouse was placed in, to where the visible platform was located, was NE to NW; SE to SW; SW to NE; and NE to SE. Next, during testing, a hidden platform (19.05 cm in diameter) was submerged without visible pillars and remained in the same location in the NE quadrant. On each day, animals were tested in two sessions, with three trials per session (total of six trials per day per animal), and were placed in different starting quadrants corresponding to the following order: SE, NW, SW. As above, in each trial, animals were allowed to navigate to the platform for up to 1 minute, removed upon successful navigation to the platform and removed/trial ended if an animal ceased swimming and floated on its back. If an animal failed to reach the platform after 1 minute (in either phase), they were placed on the platform for another minute. During all trials, investigators remained visibly hidden to the animals by stepping behind a curtain. WaterMaze6 software (Actimetrics) recorded mouse location, and experimenters measured time to reach the platform with a manual timer. The daily average of trials in either acclimatization or testing phases was averaged to compute the time spent in the target quadrant, average swimming speed (cm s−1) and time taken to reach the platform (latency). Total path traces for each trial in the test phase were manually categorized by an experimenter blinded to genotype into search strategies53: direct (6), directed search (5), focal search (4), indirect search (4), chaining (3), scanning (2), random search (1) and thigmotaxis (0). The percentage of trials adopting the various search strategies on each testing day, the composite score across trials per day and the fold change in composite score (relative to the day 1 within-genotype average) were calculated per animal. To correlate performance in the MWM with neuropathological features, animals were split into two groups based on the average fold change in the percentage of time spent in the target quadrant on day 4, with ‘better performers’ having an above-average fold change and ‘poorer performers’ having a below-average fold change.
Immunofluorescent staining, imaging and analysis of murine white matter
Coronal sections (25 µm) from 15-month-old Plp-CreERT;Nfe2l2fl/fl animals were thawed for 10 minutes and then blocked for 1 hour with 5% normal horse serum and 0.5% Triton-X (BioShop Canada, cat. no. TRX777.100) in 0.1 M PBS (Thermo Fisher Scientific, cat. no. BP399-20). Primary antibodies against Olig2 (1:100; Sigma-Aldrich, cat. no. AB9610, RRID: AB_570666), CC1 (1:200; Abcam, cat. no. AB16794, RRID: AB_443473) and PDGFRα (1:200; R&D Systems, cat. no. AF1062, RRID: AB_2236897) were incubated overnight at room temperature in a humid chamber. Tissue was washed in 0.1 M PBS three times for 5 minutes. Secondary antibodies donkey anti-goat Alexa488 (1:100; Thermo Fisher Scientific, cat. no. A-11055, RRID: AB_2534102), donkey anti-rabbit Alexa568 (1:100; Thermo Fisher Scientific, cat. no. A10042, RRID: AB_2534017) and donkey anti-mouse Alexa647 (1:100; Thermo Fisher Scientific cat. no. A-31571, RRID: AB_162542) were applied for 2 hours, alongside Hoechst (1:10,000; Thermo Fisher Scientific, cat. no.H1399). Slides were washed in 0.1 M PBS three times for 5 minutes and coverslipped with Fluoromount G (Thermo Fisher Scientific, cat. no. 00-4958-02; Thermo Fisher Scientific, cat. no. 12541033CA). For each animal, at least three 10-µm z-stack tiled images through the corpus callosum were taken on a Zeiss LSM 900 with a ×20 magnification lens (numerical aperture 0.8). Maximum projections were manually counted for density of oligodendrocyte lineage cells using ImageJ (version 2.1.0/1.53c), and the average of the three technical replicates was used as one biological replicate.
Electron microscopic sample processing, imaging and analysis of murine white matter
Twelve-month-old and 18-month-old mice were perfused with 4% PFA (Thermo Fisher Scientific, cat. no. T353-500) and 2.5% glutaraldehyde (Electron Microscopy Sciences, cat. no. 16220) in a 0.1 M sodium cacodylate solution (Electron Microscopy Sciences, cat. no. 11652). Corpus callosa were dissected and post-fixed in the above fixative for 2 weeks at 4 °C and then embedded in epoxy resin (Epon; Electron Microscopy Sciences, cat. no. 14900). Resin blocks were cut to ultra-thins (approximately 80 nm) at the Cellular and Molecular Electron Microscopy (CMEM) facility at SickKids Research Institute/Lunenfeld-Tanenbaum Research Institute and stained with uranyl acetate and lead citrate, and grids were imaged on a Hitachi HT7800 transmission electron microscope. For each animal, at least 200 myelinated axons were traced for axon diameter, myelin thickness (g ratio) and inner tongue thickness using Fiji ImageJ and assuming circularity, as above.
Statistical analysis
Statistical analyses were computed using R (version 4.4.2) or GraphPad Prism (version 10.2.3). Pearson’s correlation tests were performed for correlation analyses. For testing the difference between means of two groups, two-sided unpaired Student’s t-tests were performed when there was equal variance between groups, and Wilcoxon rank-sum tests were performed when variance was unequal. For analysis over two variables, two-way ANOVAs were used with Tukey’s post hoc multiple comparisons tests or Sidak’s/Fisher’s least significant difference (LSD) multiple comparisons correction. Grubbs testing on group means identified a statistically significant outlier to exclude from g ratio analysis at 12 months. Two animals were excluded from behavioral data analysis due to corrupted video files. For correlational graphs, the 95% confidence interval was calculated using the ggplot2 package (version 4.0.3) in R (version 4.4.2). As per General Data Protection Regulation (GDPR) requirements for the European Union, individual-level data correlating human neuropathological characteristics to identifiable demographic or clinical information could not be displayed; however, correlations among cohort-level clinical, technical and neuropathological variables were displayed via correlation matrices (Pearson’s correlations). For all correlational analyses, categorical variables of sex (male/female) and neuropathological evidence of small vessel disease (yes/no) were classed as 1 or 0, respectively, and severity of Alzheimer’s disease pathology was classified on a numeric scale of Braak pathology ranging from 0 to 6. Power calculations were performed using OpenEpi software (https://openepi.com) and reached greater than 80% power for all experiments.
Reporting summary
Further information on research design is available in the Nature Portfolio Reporting Summary linked to this article.



