
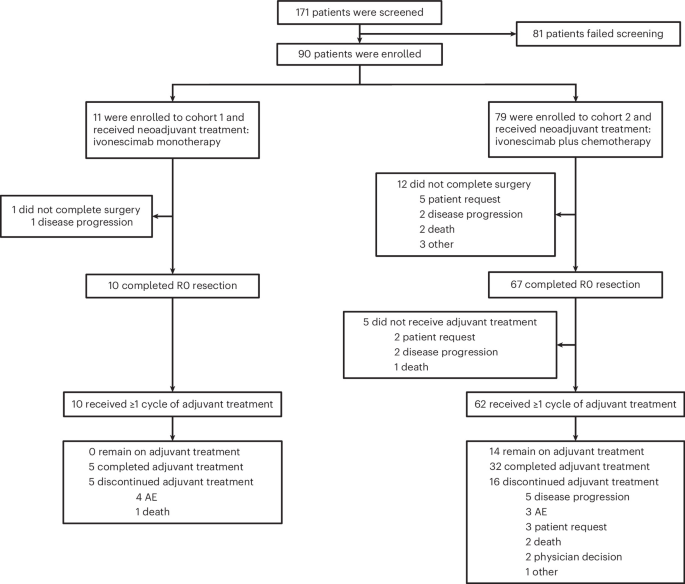
Study design and patient disposition
This nonrandomized, noncomparative, open-label, multicenter, phase 2 trial enrolled resectable NSCLC patients into two cohorts treated with perioperative ivonescimab monotherapy or ivonescimab plus platinum-paclitaxel chemotherapy, followed by surgery and adjuvant ivonescimab. Eligible patients had resectable stage II-IIIB NSCLC without sensitizing epidermal growth factor receptor (EGFR) mutations or anaplastic lymphoma kinase (ALK) translocations. The primary endpoints were MPR rate and safety of perioperative treatment. Secondary endpoints included pCR rate, EFS, objective response rate (ORR), R0 resection rate and tumor downstaging rate. Exploratory endpoint was the correlation of treatment efficacy with PD-L1 expression in tumor tissues. Additional planned endpoints, OS, pharmacokinetic profile, immunogenicity assessment and correlation between tumor-infiltrating lymphocytes and treatment efficacy are not reported in the current manuscript and are planned to be reported in future manuscripts.
Patients were recruited from Tianjin Medical University Cancer Institute and Hospital and The Fourth Hospital of Hebei Medical University between 8 March 2022 and 16 August 2024. The CONSORT flow diagram is shown in Fig. 1. A total of 90 patients were enrolled, including 11 patients in cohort 1 and 79 patients in cohort 2. At the data cutoff (18 August 2025), 10 patients (90.9%) in cohort 1 and 71 patients (89.9%) in cohort 2 completed three or four cycles of neoadjuvant treatment. A total of 10 patients (90.9%) in cohort 1 and 67 patients (84.8%) in cohort 2 underwent surgery, with lobectomy (100% (10/10) in cohort 1 and 89.6% (60/67) in cohort 2) being the most common surgical procedure. A total of 13 patients did not complete surgery, including 1 in cohort 1 and 12 in cohort 2. Reasons for cancellation included patient request in five patients, disease progression in three patients, death (unrelated to the study drug) in two patients and other reasons in three patients (one each due to low blood oxygen after anesthesia, poor pulmonary function and poor general condition). A total of 10 patients (90.9%) in cohort 1 and 62 patients (78.5%) in cohort 2 received at least one cycle of adjuvant treatment; 5 patients (45.5%) and 32 patients (40.5%) completed adjuvant treatment; 0 patient and 14 patients (17.7%) remained on adjuvant treatment, respectively. The median follow-up time was 36.70 months in cohort 1 and 24.15 months in cohort 2.
Flow diagram depicts the disposition of patients throughout the phases of the study, including screening, neoadjuvant treatment, surgery and adjuvant treatment. CONSORT, Consolidated Standards of Reporting Trials.
Baseline characteristics are presented in Table 1. The median age was 64 years in both cohorts. Overall, the majority of patients had squamous NSCLC (72.7% (8/11) in cohort 1 and 78.5% (62/79) in cohort 2), a PD-L1 tumor proportion score (TPS) of ≥1% (81.8% (9/11) and 72.2% (57/79), respectively), stage III disease (72.7% (8/11) and 81.0% (64/79), respectively) and N1/N2 stage disease (72.7% (98/11) and 93.7% (74/79), respectively). Notably, in the two cohorts, stage IIIB disease accounted for 63.6% (7/11) and 36.7% (29/79), while N2 stage disease represented 72.7% (8/11) and 70.9% (56/79), respectively.
Primary outcome
The MPR rates assessed in the completed surgery set (CSS) population are presented in Fig. 2 and Table 2. MPR was achieved in 6 patients (60.0%; 95% confidence interval (CI) = 26.2–87.8) in cohort 1 and 47 patients (70.1%; 95% CI = 57.7–80.7) in cohort 2. Per the prespecified success criterion, the lower bound of the 80% two-sided CI for the MPR rate exceeded the historical control rate of 41%; the primary endpoint was therefore met. Among patients who achieved MPR, 83.3% (5/6) in cohort 1 and 97.9% (46/47) in cohort 2 had a pathological regression larger than 95%, which corresponds to residual viable tumor (RVT) of ≤5% in 50.0% (5/10) and 68.7% (46/67) of the total CSS population in cohort 1 and cohort 2, respectively. The MPR rates analyzed in full analysis set (FAS) population are shown in Extended Data Table 1.
a,b, Only data from patients who underwent surgery (a, n = 10 for cohort 1; b, n = 67 for cohort 2) were included. BOR, best overall response (assessed in the neoadjuvant phase); PR, partial response; SD, stable disease; CR, complete response; Q3W, every three weeks.
Secondary outcomes
The pCR rates assessed in the CSS population are presented in Fig. 2 and Table 2. pCR was observed in 3 patients (30.0%; 95% CI = 6.7–65.2) in cohort 1 and 34 patients (50.7%; 95% CI = 38.2–63.2) in cohort 2. The pCR rates analyzed in FAS population are shown in Extended Data Table 1.
In the neoadjuvant phase, the ORR was 81.8% (9/11; 95% CI = 48.2–97.7) in cohort 1 and 81.0% (64/79; 95% CI = 70.6–89.0) in cohort 2 (Extended Data Table 2). Compared with the disease stage at enrollment, 7 patients (63.6%) in cohort 1 and 27 patients (34.2%) in cohort 2 achieved clinical tumor downstaging after neoadjuvant treatment (Extended Data Table 2 and Supplementary Fig. 1). T-stage downstaging was observed in 9 (81.8%) patients in cohort 1 and 53 (67.1%) patients in cohort 2. Notably, in cohort 2, 69 (87.3%) patients showed no change in N stage, which likely explains the relatively low clinical downstaging rate (34.2%) in this cohort. Notably, among the 63 patients with unchanged N stage who underwent surgery, 30 patients (47.6%) had achieved pCR. All patients who underwent surgery (10 in cohort 1 and 67 in cohort 2) achieved R0 resection (100%; Extended Data Table 3).
Median EFS data were not mature in either cohort at data cutoff. The 12-month EFS rate was 81.8% (95% CI = 44.7–95.1) in cohort 1 and 83.3% (95% CI = 72.4–90.1) in cohort 2.
Safety
Treatment-emergent adverse events (AEs) were reported in 10 patients (90.9%) in cohort 1 and 78 patients (98.7%) in cohort 2 (Extended Data Table 4). Any grade AEs determined by the investigator to be related to ivonescimab occurred in 9 patients (81.8%) in cohort 1 and 64 patients (81.0%) in cohort 2, with grade 3 or higher treatment-related AEs occurring in 4 (36.4%) and 24 patients (30.4%), respectively. Treatment-related AEs that occurred in 10% or more of patients are summarized in Table 3. In cohort 1, grade 3 or higher treatment-related AEs included proteinuria, lipase increased and liver injury, with one case reported for each event (9.1%); in cohort 2, the most common grade 3 or higher treatment-related AEs were neutrophil count decreased (15.2% (12/79)) and white blood cell count decreased (7.6% (6/79)). Serious AEs related to ivonescimab occurred in two (18.2%) and five (6.3%) patients, respectively. No treatment-related AEs leading to death occurred.
AEs related to VEGF blocking occurred in 5 patients (45.5%) in cohort 1 and 23 patients (29.1%) in cohort 2, with grade 3 or higher events occurring in 1 patient (9.1%) and 4 patients (5.1%), respectively (Extended Data Table 5). Proteinuria was the most common AE possibly related to VEGF blocking in both cohorts, with an incidence of 45.5% (5/11) in cohort 1 and 22.8% (18/79) in cohort 2; while most cases were grades 1 and 2, grade 3 or higher proteinuria was observed in one patient in cohort 1 and three patients in cohort 2. Hemorrhage was reported in one patient (9.1%) in cohort 1 and five patients (6.3%) in cohort 2, with no grade 3 or higher cases observed. Hypertension occurred in five patients (6.3%) in cohort 2, with only one patient reporting grade 3 or higher hypertension.
None of the treatment-related AEs led to canceled surgery. One patient (1.3%) in cohort 2 developed abnormal vital capacity after neoadjuvant treatment, leading to delayed surgery (Extended Data Table 4). Among patients who underwent surgery, grade 3 or higher surgery-related AEs occurred in 40.0% (4/10) in cohort 1 and 13.4% (9/67) in cohort 2. Surgery-related AEs related to ivonescimab occurred in 10.0% (1/10) patients in cohort 1 and in 10.4% (7/67) patients in cohort 2, but none of the events were grade 3 or higher (Extended Data Table 6).
Exploratory outcomes
Subgroup analyses of pathological response by PD-L1 TPS status, histological type and clinical stage were performed in cohort 2. The PD-L1 TPS < 1% and ≥1% subgroups had comparable MPR rates (69.2% versus 69.2%), while the PD-L1 TPS ≥ 1% subgroup had a notably higher pCR rate (55.8% versus 30.8%). The squamous carcinoma subgroup achieved substantially better pathological responses than the nonsquamous carcinoma subgroup. The MPR rates were 81.5% (44/54; 95% CI = 68.6-90.7) and 23.1% (3/13; 95% CI = 5.0–53.8), respectively, and the pCR rates were 61.1% (33/54; 95% CI = 46.9–74.1) and 7.7% (1/13; 95% CI = 0.2–36.0), respectively. Among patients with stage III disease, the MPR rate was 65.5% (36/55; 95% CI = 51.4–77.8) and the pCR rate was 47.3% (26/55; 95% CI = 33.7–61.2). By comparison, patients with stage II disease had even higher response rates, with MPR rate of 91.7% (11/12; 95% CI = 61.5–99.8) and pCR rate of 66.7% (8/12; 95% CI = 34.9–90.1; Table 2).
Subgroup analyses of radiological response by histological type were performed in cohort 2. The ORR was 82.3% (51/62; 95% CI = 70.5–90.8) in patients with squamous carcinoma and 76.5% (13/17; 95% CI = 50.1–93.2) in those with nonsquamous carcinoma.
Subgroup analyses of EFS by histological type were performed in cohort 2. The 12-month EFS rates were 84.0% (95% CI = 71.4–91.3) and 80.4% (95% CI = 50.6–93.2) for patients with squamous and nonsquamous carcinoma, respectively.
Post hoc analyses
Subgroup analyses of pathological response by N2 stage were performed in cohort 2. The MPR rate was 63.6% (21/33; 95% CI = 45.1–79.6) for N2a (single station) and 66.7% (10/15; 95% CI = 38.4–88.2) for N2b (multistation) disease; the corresponding pCR rates were 45.5% (15/33; 95% CI = 28.1–63.6) and 53.3% (8/15; 95% CI = 26.6–78.7), respectively.
Relationship between circulating tumor DNA (ctDNA) and pathological responses was investigated to explore potential biomarkers for predicting treatment response. Next-generation sequencing was performed on 69 patients (7 from cohort 1 and 62 from cohort 2; Extended Data Fig. 1). Baseline ctDNA was detected in 52 of 69 individuals (75.4%). TP53 (39.1%, 27/69), ARID1A (10.1%, 7/69) and LRP1B (10.1%, 7/69) were the most frequently mutated genes at baseline(n = 69; Fig. 3a). Among the 48 patients with detectable mutations in baseline ctDNA who were evaluable for pathological response, no correlation was observed between gene mutations and MPR/non-MPR or pCR/non-pCR (all P > 0.05; Extended Data Fig. 2). From baseline to the first day of the third cycle of neoadjuvant therapy (C3D1) and presurgery, the ctDNA-positive rate decreased from 75.4% to 40.9% (P < 0.0001) and further to 30.5% (Fig. 3b). Similarly, the ctDNA abundance also showed a decline (Fig. 3c), with a significant difference among the baseline, C3D1 and presurgery (all P < 0.0001), indicating a continuous reduction in tumor burden during treatment. Specifically, of the 52 baseline ctDNA-positive patients, 43 had evaluable presurgical samples. The overall ctDNA clearance rate was 65.1% (28/43), with 66.7% (26/39) in the combination therapy group and 50% (2/4) for the monotherapy group (Extended Data Fig. 3a). As illustrated in the Sankey diagram, among the patients who achieved MPR or pCR, 70.0% (29/41) of those with MPR and 79.3% (23/29) of those with pCR had cleared ctDNA before surgery, which included patients who were either ctDNA-negative at baseline or who cleared ctDNA during therapy (Fig. 3d and Extended Data Fig. 3c). The relationship between pCR/MPR and ctDNA status at baseline, C3D1 and presurgery was analyzed (Extended Data Figs. 3b,d and 4). Among all time points, the distinction in pCR rates between the ctDNA-negative group and ctDNA-positive group was most pronounced (57.5% versus 33.3%) before surgery (Extended Data Fig. 3b). Across all time points, patients with sustained ctDNA negativity achieved the highest pCR rate (pattern 1, 69.2%), followed by those negative at both C3D1 and presurgery (pattern 2, 56.5%) and those negative only at presurgery (pattern 3, 44.4%; Extended Data Fig. 3d).
a, The top 30 most common gene alterations of the primary tumors of the 69 patients. Each column represents an individual patient. Clinical characteristics including pathological type, tumor response and clinical stage are shown at the top. b, ctDNA positivity in patients tested at baseline (n = 69; 52 positive, 75.4%), C3D1 (n = 66; 27 positive, 40.9%) and before surgery (n = 59; 18 positive, 30.5%). One blood sample per patient was analyzed at each evaluable time point; patients with missing samples were excluded from that time point’s denominator. Pairwise two-sided Fisher’s exact tests—baseline versus C3D1, OR 4.42 (95% CI = 2.12–9.40), P = 5.68 × 10⁻⁵; baseline versus presurgery, OR = 6.97 (95% CI = 3.10–14.93), P = 4.38 × 10⁻⁷; C3D1 versus presurgery, OR = 1.58 (95% CI = 0.73–3.31), P = 0.265. P values and CIs were not adjusted for multiple comparisons. c, ctDNA abundance (ng ml−1) at three time points, plotted as log2(x + 1), where x is abundance in ng ml−1. Samples were available from n = 69 patients at baseline, n = 66 at C3D1, and n = 59 before surgery; each dot represents one patient sample. Violins show distributions; boxes span the 25th–75th percentiles, centerlines indicate medians (50th percentile) and the whiskers extend to the smallest and largest observations that are within 1.5× interquartile range from the box edges. All observations are plotted, including outliers beyond the whiskers. The Kruskal–Wallis test yielded H = 30.071, df = 2, P = 2.95 × 10⁻⁷. Two-sided Dunn tests with Bonferroni adjustment gave baseline versus C3D1, z = − 4.8415, adjusted P = 3.87 × 10⁻⁶; baseline versus presurgery, z = − 4.5647, adjusted P = 1.50 × 10⁻⁵; and C3D1 versus presurgery, z = 0.13492, adjusted P = 1.00. d, Sankey diagram illustrating the dynamic change of ctDNA status (positive/negative/NA) at three time points and their corresponding pathologic outcomes (MPR/non-MPR). NA, ctDNA was not detected; CNV, copy number variant; SV, structural variant.