
Study design
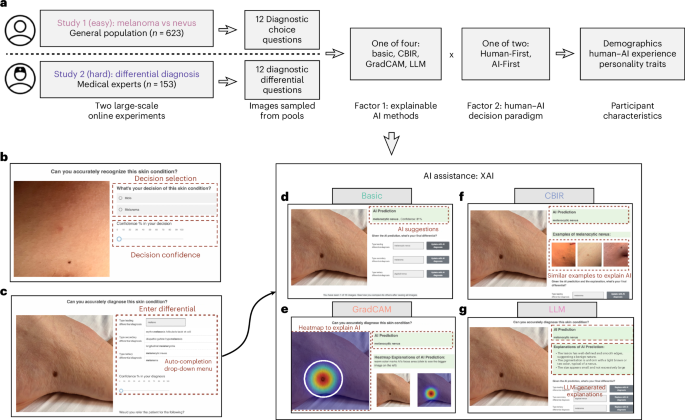
We designed two complementary large-scale experiments to evaluate human−AI collaborative diagnostic performance across expertise levels (Fig. 1a). Study 1 engaged the general public (n = 623) in a binary classification task to distinguish melanoma from nevus. Study 2 engaged PCPs (n = 153) in a complex open-ended differential diagnosis task, focusing on four skin conditions previously identified as having potential diagnostic disparities across skin tones22,33: atopic dermatitis, pityriasis rosea, Lyme disease and cutaneous T cell lymphoma (CTCL). Studies 1 and 2 are not directly comparable as they emphasize different tasks. To measure the impact of medical training within the same task, for study 2, we recruited another cohort of medical students (n = 320) for comparison.
a, Overview of the experimental workflow comprising two studies: study 1 recruited general public participants for melanoma versus nevus classification tasks; study 2 engaged medical experts for open-set differential diagnosis. Twelve diagnostic images were randomly drawn from a high-quality image database with an equal skin tone split. Participants completed either Human-First or AI-First diagnostic sequences followed by demographics, human−AI collaboration experience and personality assessment. b, Interface for the binary classification task showing a clinical image for melanoma versus nevus discrimination. c, Interface for the differential diagnosis task with top-3 free-text entry. To assist user input, the text box has a string-matching-based auto-completion function that covers a comprehensive set of 445 skin diseases. d−g, Four XAI assistance examples with basic AI providing straightforward predictions with model confidence (d), GradCAM highlighting relevant image regions (e), CBIR showing similar reference cases (f) and LLM providing natural language explanations (g). Skin images are not clinical images but are from the authors as placeholders for illustration. GradCAM and CBIR are synthetic and do not represent the real model performance.
We employed a randomized between-subjects factorial design (4 × 2) across both studies. Participants were assigned to one of four AI assistance methods—basic (prediction and confidence), GradCAM (heatmap), CBIR (visual similarity) or multimodal LLM (textual explanation)—and one of two decision paradigms: Human-First (users make a decision first before reviewing AI suggestions) and AI-First (users review both images and AI suggestions before making the final decision). All participants evaluated 12 clinical images balanced by skin tone and pathology, utilizing outputs from fairness-constrained deep learning models.
Our fairness-constrained models (final architectures and hyperparameters reported in Methods) achieved strong overall performance with substantially reduced disparities across skin tones. For study 1, the binary classification model achieved a weighted area under the receiver operating characteristic (AUROC) of 0.930 (0.933/0.898 light/dark skin, Δ = 0.035) and weighted balanced accuracy of 0.850 (0.852/0.831, Δ = 0.021), narrowing the empirical risk minimization (ERM) baselineʼs skin tone gap (balanced accuracy 0.845, Δ = 0.091) by 76.9%. For study 2, the primary five-class model achieved AUROC of 0.772 (0.782/0.691, Δ = 0.091), weighted AUROC of 0.753 (0.725/0.693, Δ = 0.192) and balanced accuracy of 0.478 on the four main diseases (0.487/0.431, Δ = 0.056), outperforming ERM (0.457, Δ = 0.144). The secondary 30-class model achieved AUROC of 0.728 (0.714/0.641, Δ = 0.073), weighted AUROC of 0.752 (0.798/0.744, Δ = 0.053) and balanced accuracy of 0.141 (0.157/0.092, Δ = 0.064). Combined, the primary and secondary models achieved overall weighted accuracy of 0.197 and AUROC of 0.755. Per-disease performance is in Supplementary Tables 5 and 6.
In the study, images were intentionally sampled to have an overall AI accuracy of 83.3% (always 10 correct and two incorrect predictions) in study 1 and 79.2% (on average, 9.5 correct and 2.5 incorrect) in study 2 (see Methods for full details on model training, dataset curation and experimental protocol).
State-of-the-art AI improves the general public’s performance due to AI deference and LLM explanations amplify such deference
Advanced AI improves the general public’s performance
We first measured the general publicʼs performance (study 1) without and with AI assistance. We found that AI improved average accuracy of the nevus versus melanoma detection task from 69.7 ± 0.8% to 75.8% ± 0.7% (effect of AI assistance: β = 0.061, 95% confidence interval (CI): 0.049−0.074, P < 0.001, linear mixed model on accuracy, with AI assistance, XAI methods and their interaction as the main factor, controlling gender, age, race, skin disease experience and the covariate of self-reported human−AI collaboration experience; see Supplementary Table 7 for details). Other study 1 statistical models below control the same set of confounders (unless noted differently), and most of the improvement came from nevus classification (β = 0.111, 95% CI: 0.091−0.132, P < 0.001; Fig. 2a and Supplementary Table 8), and the largest improvement in XAI came from multimodal LLM (see next section). Participants also had a modest increase in diagnosis confidence by 1.5% with AI assistance (β = 0.018, 95% CI: 0.010−0.019, P < 0.001; Extended Data Fig. 1a and Supplementary Table 10). With the help of AI, model humans achieved a more balanced diagnosis performance across patient skin tones (round 1: β = 0.033, 95% CI: 0.009−0.057, P = 0.007; round 2: β = 0.017, 95% CI: −0.007 to 0.041, P = 0.166; \({\Delta }_{\mathrm{rel}}\) = 46.9%; Fig. 2c and Supplementary Table 11). As no interactive effects across different XAI methods, skin tones and decision rounds were found (P > 0.05 for all; Supplementary Table 11), the reduced diagnostic disparities were mainly contributed by the fairness-constrained training algorithm (conditional domain adversarial neural network (CDANN); see Model training section). These findings demonstrate that collaboration with well-trained AI can mitigate diagnostic biases while improving overall accuracy.
a, Accuracy of the general public (n = 335) in detecting nevus and melanoma and the overall diagnosis in two rounds of testing: Rd. 1 tested initial human accuracy without AI assistance; Rd. 2 tested AI-assisted accuracy. b, Diagnostic accuracy changes between Rd. 2 and Rd. 1 across different AI explanations (Basic (n = 82), GradCAM (n = 72), CBIR (n = 91) and LLM (n = 90), same in e and f) in the Total condition of a. c, Diagnostic accuracy when patients are light-skinned (Fitzpatrick labels 1−4 on a scale of 6) or dark-skinned (Fitzpatrick labels 5−6) across two rounds in the Total condition of a. d, Overall accuracy changes (n = 335) between Rd. 1 and Rd. 2 under AI-right and AI-wrong conditions. e,f, Diagnostic accuracy changes between Rd. 1 and Rd. 2 of different AI explanations under AI-right (e) and AI-wrong (f) predictions. Each gray transparent scatter represents one measured sample. All presented bars or data points of a plot in this figure indicate the mean values of metrics measured. All error bars indicate the standard error of the mean. P values were calculated with post hoc marginal comparison after an initial analysis with a linear mixed model. ***P < 0.001, **P < 0.01, *P < 0.05. NS, not significant; Rd., round.
Source data
Performance improvement stems from AI deference and LLM-based explanations amplify such deference
We investigated the impact of the four XAI methods on diagnostic accuracy. The LLM explanations provided an improvement of +7.7% (β = 0.077, 95% CI: 0.053−0.101, P < 0.001), followed by CBIR (+6.3%, β = 0.063, 95% CI: 0.039−0.087, P < 0.001), GradCAM (+5.5%, β = 0.054, 95% CI: 0.028−0.081, P < 0.001) and the basic method (+4.8%, β = 0.048, 95% CI: 0.023−0.073, P < 0.001), as shown in Fig. 2b and Supplementary Table 7. However, the general publicʼs diagnostic accuracy improved when AI provided correct predictions, whereas incorrect predictions reduced the performance significantly (β = −0.233, 95% CI: −0.307 to −0.158, P < 0.001; Fig. 2d and Supplementary Table 12). Correct LLM advice (+13.4%) enhanced performance more than other AI explanations (basic method +8.6%, GradCAM +9.5%, CBIR +10.9%; Fig. 2e), and incorrect LLM advice decreased performance most (−21.1%, basic −14.6%, GradCAM −15.3% and CBIR −17.0%; Fig. 2f). These findings indicate that LLM explanations amplify the general publicʼs tendency to follow AI guidance, regardless of AI accuracy. Moreover, compared to basic explanation, LLM led to significantly more reduction of performance when AI becomes inaccurate (that is, difference in differences, β = −0.048, 95% CI: −0.093 to −0.003, P = 0.035; Supplementary Table 13).
Misplaced trust in LLM explanations for the general public
When AI predictions were correct, participants trusted LLM explanations more than other methods (Fig. 2e), and this was more noticeable when explanations were of low quality (post hoc pairwise estimated marginal means (EMMs) comparisons, LLM over GradCAM: β = 0.117, 95% CI: 0.041−0.192, P = 0.002; LLM over CBIR: β = 0.092, 95% CI: 0.021−0.163, P = 0.011; Extended Data Fig. 2c and Supplementary Table 15). When AI predictions were incorrect, LLM explanations negatively impacted the alignment between participantsʼ confidence and accuracy (z = −3.788, P < 0.001, two-sided Fisherʼs r-to-z test to compare correlation difference; Extended Data Fig. 3c). These results further suggest that people struggle to assess LLM explanation reliability and can be easily misled by LLMs.
Study 1 results indicate that LLMs are a ‘double-edged sword’ in skin disease diagnosis for the general public with amplified AI deference. When AI was correct, LLM explanations boosted diagnosis performance, even when the quality of the explanation was low. However, when AI predictions were incorrect, the general public was misled by seemingly plausible reasons generated by LLM, whose explanations frequently referenced ambiguous dermatologic criteria even when these features were only partially present or visually unclear.
PCPs reliably leverage accurate AI guidance while resisting errors with LLM-based AI explanation
Basic AI improves performance of PCPs
We conducted a similar analysis of the PCP participants in study 2. This task was more challenging and required detailed dermatological knowledge. We found 11.5 ± 1.4% top-1 accuracy and 16.1 ± 1.8% top-3 accuracy in differential diagnoses of PCP without AI, which is aligned with previous work22. The performance was significantly improved with AI suggestions, with a +21.5% in top-1 accuracy (β = 0.258, 95% CI: 0.170−0.260, P < 0.001; Fig. 3a; linear mixed model on accuracy with AI assistance, XAI methods and their interaction as the main factor, controlling gender, age, race and medical expertise in skin, year of experience and personality traits; see Supplementary Table 16 for details). Other study 2 statistical models below control the same set of confounders (unless noted differently) and a +43.5% in top-3 accuracy (β = 0.450, 95% CI: 0.352−0.548, P < 0.001; Extended Data Fig. 4a and Supplementary Table 16). In contrast to the general public in study 1, for PCPs, basic AI assistance helped the most (top-1 accuracy β = 0.258, 95% CI:0.168−0.349, P < 0.001; Fig. 3b and Supplementary Table 16). Interestingly, we observed significant confidence increase only when PCPs were assisted by GradCAM (β = 0.028, 95% CI: 0.005−0.051, P = 0.019) and LLM explanations (β = 0.035, 95% CI: 0.012−0.058, P = 0.003) (Extended Data Fig. 1b and Supplementary Table 21). Improvements were significant in all four major diseases (+19.9−25.0%, all P < 0.001; Fig. 3a and Supplementary Tables 17−20). PCPs had disparate performance across skin tones as 4.6% (β = 0.046, 95% CI: 0.013−0.078, P = 0.069; Fig. 3c), which was reduced to 2.9% (β = 0.029, 95% CI: −0.018 to 0.076, P = 0.248; Supplementary Table 22) after AI assistance. Similar to the general public, no interactive effects of different XAI methods were found (P > 0.05 for all conditions; Supplementary Table 22), showing that the reduced disparities still resulted from CDANN.
This figure shows similar analysis results as in Fig. 2 using the Human-Frst paradigm. a, Accuracy of PCPs (n = 96) in identifying atopic dermatitis, pityriasis rosea, Lyme disease and CTCL as well as the overall performance on four main diseases, with results presented for two rounds of testing. b, Diagnostic accuracy changes between Rd. 1 and Rd. 2 across different AI explanations (Basic (n = 24), GradCAM (n = 25), CBIR (n = 21) and LLM (n = 26), same as e and f). c, Diagnostic accuracy when patients are light-skinned (Fitzpatrick labels 1−4 on a scale of 6) or dark-skinned (Fitzpatrick labels 5−6) across the two rounds of testing. d, Overall accuracy (n = 96) changes between Rd. 1 and Rd. 2 under AI-right and AI-wrong conditions. e,f, Diagnostic accuracy changes between Rd. 1 and Rd. 2 of different AI explanations under AI-right (e) and AI-wrong (f) predictions. Each gray transparent scatter represents one measured sample. All presented bars or data points of a plot in this figure indicate the mean values of metrics measured. All error bars indicate the standard error of the mean. P values were calculated with post hoc marginal comparison after an initial analysis with a linear mixed model. ***P < 0.001, **P < 0.01, *P< 0.05. NS, not significant; Rd., round.
Source data
PCPs are resilient to AI deference when AI is wrong
In contrast to the general public, incorrect AI predictions had minimal impact on the final decisions of PCPs across all XAI methods (Fig. 3f and Extended Data Fig. 2d−f; β = 0−0.021, P = 0.328−1.000). This suggests that PCPs relied on their own expertise and training rather than erroneous AI guidance. To control the effect of task difficulty between study 1 and study 2, we further compared the results of PCPs against the results of medical students on the same task. Extended Data Fig. 5 shows that medical students relied on AI more than PCPs, regardless of AI correctness. We term participants who answered correctly only when AI was correct—and, therefore, answered incorrectly when AI was wrong—as ‘deferential participants’. We observed that the proportion of deferential participants was higher among medical students than PCPs (linear mixed model on the proportion of deferential participants, with medical role and medical expertise in skin as the main factor, controlling other confounders: main effect of medical role: β = 0.067, 95% CI: 0.004−0.130, P = 0.037; main effect of skin expertise: β = 0.073, 95% CI: 0.022−0.124, P = 0.005; Supplementary Table 25). These results indicate that higher expertise levels are associated with more careful AI adoption, which is supported by previous work10.
LLM explanations do not aid in accuracy but in confidence calibration
Interestingly, for PCPs, LLM explanations were the least helpful method (+17.7%) and were 8.1% lower than the best improvement from the basic explanations (β = −0.081, 95% CI: −0.207 to 0.044, P = 0.268; Fig. 3b and Supplementary Table 16). This finding was consistent across explanation quality (Extended Data Fig. 2e,g and Supplementary Table 27) and top-3 accuracy (Extended Data Fig. 4c−f). These are opposite to the results of LLMʼs best improvement for the general public in study 1. Medical student data confirmed that the task was not biased toward certain explanations (Extended Data Fig. 5c), implying that expertise drove interactions: the general public overrelies on LLMs, whereas PCPs are more resilient to incorrect LLM suggestions.
However, LLM explanations did help improve the alignment between PCP participantsʼ confidence and accuracy (correlation r = 0.494, P = 0.010; Extended Data Fig. 3d; similar findings in top-3 performance; Extended Data Fig. 6d) over No AI (correlation r = 0.084, P = 0.415, two-sided Fisherʼs r-to-z test comparing the two correlations: z = 2.368, P = 0.018; Extended Data Fig. 3d). This calibration benefit held even with incorrect AI predictions, where non-LLM explanations impaired alignment (Fisherʼs r-to-z test z = 2.572, P = 0.010; Extended Data Fig. 3f; similar in top-3 performance, P = 0.059; Extended Data Fig. 6f). PCP caution toward LLMs likely enforces cognitive engagement, thus enhancing diagnostic accuracy−confidence calibration regardless of correctness34,35.
Overall, in contrast to the general public in study 1, PCPs maintained their performance under incorrect AI predictions across all XAI methods, including LLM.
Higher AI deference correlates with lower initial performance
We inspected the relationship between participantsʼ deference toward AI suggestions and initial performance30. Among participantsʼ final decisions that are correct (ranging from zero to 12, 12 images total), we visualize the number of images with AI suggestions that are correct (up to 10, shown in blue) and incorrect (up to two, shown in red) for each participant (Fig. 4a). As mentioned above, ‘deferential participants’ are those who got correct results only when AI was correct and always got incorrect results when AI was wrong (that is, a blue bar in Fig. 4a,d). Participants who got at least one correct outcome even when AI was incorrect are considered as ‘non-deferential participants’ (that is, a red bar on top of the blue bar in Fig. 4a,d).
a,b, Performance comparison between deferential (fully compliant with AI suggestions) and non-deferential general populations. a, Distribution of correct responses with AI assistance. The blue bars represent instances where both AIʼs predictions and participantsʼ predictions were correct; the red overlays indicate instances where participants’ responses were correct while AI predictions were incorrect. b, Accuracy trajectories of deferential users (n = 142) and non-deferential users (n = 193) found from a across two decision rounds. c, Proportion of participants who defer to the output of each type of XAI (Basic (n = 82), GradCAM (n = 72), CBIR (n = 91) and LLM (n = 90)). d−f, Equivalent results for PCP participants as in a−c (in e, deferential PCPs n = 79, non-deferential PCPs n = 17; in f, Basic (n = 24), GradCAM (n = 25), CBIR (n = 21) and LLM (n = 26)). All presented bars or data points of a plot in this figure indicate the mean values of metrics measured. All error bars indicate the standard error of the mean. P values were calculated with post hoc marginal comparison after an initial analysis with a linear mixed model. ***P < 0.001, **P < 0.01, *P < 0.05. NS, not significant; Rd., round.
Source data
Although the general public had similar performance after AI assistance, deferential participants had significantly lower initial diagnostic accuracy (65.8%) compared to non-deferential participants (72.5%) before receiving AI suggestions (β = 0.082, 95% CI: 0.074−0.111, P < 0.001, Cohen’s d = 0.462; Fig. 4b; linear mixed model with deferential group as the main factor, controlling the same confounders as study 1 analysis) (Supplementary Table 28). Deferential PCPs also had a significantly lower performance in the initial round (β = 0.194, 95% CI: 0.079−0.310, P < 0.001, Cohen’s d = 1.578; Fig. 4e and Supplementary Table 29), which could result from a lower level of critical thinking (P = 0.028, measured by critical thinking questionnaire36; see details in Methods).
LLM explanations led to the largest proportion of fully deferential participants in the general public (Fig. 4c), although no significance between LLM and others was observed (P = 0.169−0.433; Supplementary Table 30). By contrast, LLM resulted in the lowest proportion of deferential PCPs (Fig. 4f; P = 0.268−0.587; Supplementary Table 31). This is also aligned with our findings of the capability of experts in maintaining resilience against the misdirection of wrong semantic AI explanations10.
Putting AI before human decisions amplifies deference across expertise levels
In addition to XAI methods, a practical design factor for human−AI collaboration systems is the decision-making order, either Human-First or AI-First paradigms. Both the general public and PCPs had significantly better performance in the first round with AI-First (all P < 0.001; Fig. 5a,d), which is not surprising due to superior AI performance. In the second round, after humans received the same amount of information, no difference was observed between Human-First and AI-First in either study (round 2, general public: β = 0.005, 95% CI: −0.017 to 0.026, P = 0.650; PCPs: β = −0.020, 95% CI: −0.091 to 0.050, P = 0.572; linear mixed models on accuracy with human−AI collaboration paradigm, decision round and their interaction as the main factors, controlling decision-making time and other confounders; see Supplementary Tables 32 and 34 for details). This indicates that the decision order may not influence the final performance. To exclude the influence where participants would be biased in the second round due to the prior exposure of the disease image, we compared AI-assisted performance in AI-First round 1 versus performance in Human-First round 2 and found no differences (P > 0.05 for both general public and PCPs; Supplementary Tables 38 and 39), indicating that the diagnosis strategies were not driven by the carryover effect.
a−d, Analysis for the general public. a, Comparison between AI-First (n = 288) and Human-First (n = 335) human−AI collaboration (HAI) systems on diagnostic accuracy across two rounds. b, Accuracy trajectories across two decision rounds for deferential and non-deferential people in the AI-First paradigm. c, Comparison of deferential user (participants who defer to the output of each type of XAI) proportion between two HAI paradigms across four XAI groups (AI-First: Basic (n = 62), GradCAM (n = 74), CBIR (n = 76) and LLM (n = 76); Human-First: Basic (n = 82), GradCAM (n = 72), CBIR (n = 91) and LLM (n = 90)). d−f, Equivalent results for PCP participants (AI-First PCPs n = 57, among which Basic (n = 14), GradCAM (n = 18), CBIR (n = 8) and LLM (n = 17); Human-First PCPs n = 96, among which Basic (n = 24), GradCAM (n = 25), CBIR (n = 21) and LLM (n = 26)) as a−c. All presented bars or data points of a plot in this figure indicate the mean values of metrics measured. All error bars indicate the standard error of the mean. P values were calculated with post hoc marginal comparison after an initial analysis with a linear mixed model. ***P < 0.001, **P < 0.01, *P < 0.05. NS, not significant; Rd., round.
Source data
With the AI-First paradigm, non-deferential participants still had better performance, especially after reviewing the examples again without AI (general public: β = 0.031, 95% CI: 0.000−0.062, P = 0.049; Supplementary Table 33; PCPs: β = 0.218, 95% CI: 0.009−0.426, P = 0.041; Supplementary Table 35). This is similar to the results in the Human-First paradigm in Fig. 4. By contrast, putting AI suggestions ahead increased the proportion of deferential participants in most cases (Fig. 5c,f). For the general public, the proportion was increased across all XAI methods (average Δ = +8.4%, although no significance was observed after controlling all confounders, P = 0.067−0.170; Fig. 5c and Supplementary Table 36). For PCPs, the largest deference increase was observed from LLM explanations (Δ = +19.0%; Fig. 5f, Extended Data Fig. 6m and Supplementary Table 37). This indicates that putting AI ahead may lead to stronger anchoring bias. It also suggests that, although PCPs showed resistance against AIʼs mislead in the Human-First paradigm, providing LLM-based explanations ahead of human choices can still cause more bias than other XAI methods and introduce risks of overreliance, even for PCPs.
Human−AI collaboration to combine each sideʼs strength
Although AI deference risks misleading participants when AI makes mistakes, deference may lead some humans to improved performance. Figure 6 visualizes cases where either humans or AI routinely outperform each other. We found that AI tends to outperform humans in cases where the presentation of the disease is subtle but struggles with atypical symptoms or unexpected features in the image (see Supplementary Table 40 for example information). These qualitative examples provide some initial directions for future work in understanding the complementary strengths of humans and AI in dermatological diagnosis.
a, Accuracy proportion of images in study 1 for the general public, categorized by whether the AI prediction was correct or incorrect. The blue bars represent the proportion of correct human participantsʼ decisions; the red overlays indicate their incorrect decisions. Representative images are labeled as ‘AI did better than human’ (AI-right images with the highest human error rate), and ‘Human did better than AI’ (AI-wrong images with the highest human accuracy) is shown to the right. b, Same as a for study 2 for PCPs. Detailed examples can be found in Supplementary Table 40. pred, prediction.



