
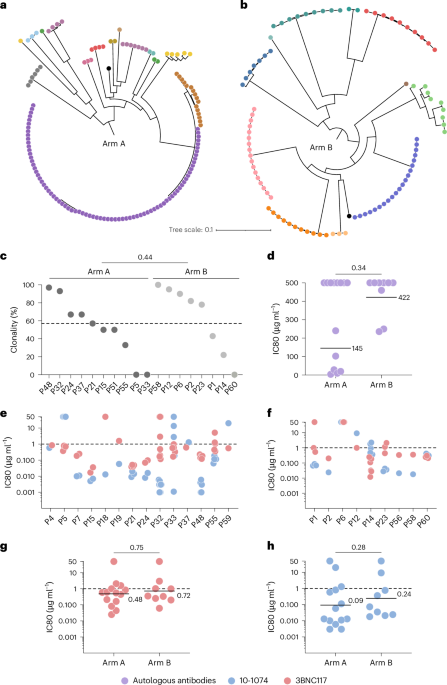
Ethics statement
This study complied with all relevant ethical regulations. The RIO trial was approved by the London–Westminster Research Ethics Committee (REC reference 19/LO/1669; IRAS ID 266322), the UK Health Research Authority and the UK Medicines and Healthcare products Regulatory Agency (MHRA reference 19174/0413/001) and the Danish Medicines Agency. The trial was registered under the European Union Drug Regulating Authorities Clinical Trials (EudraCT) database (2019-002129-31) and the European Union Clinical Trials Regulation (EU CT number 2024-514564-13-00) and registered at ClinicalTrials.gov (NCT04319367). The trial was conducted in accordance with the principles of the Declaration of Helsinki and Good Clinical Practice guidelines. All participants provided written informed consent before enrollment. Trial oversight included independent Data Monitoring and Trial Steering Committees that regularly reviewed participant safety and trial conduct.
Study participants
The RIO trial is a randomized, placebo-controlled, double-blinded phase 2 study37. Participants were recruited across multiple HIV clinical research sites in the United Kingdom and one site in Denmark. Participants were randomly assigned in a 1:1 ratio using a centralized web-based randomization system with variable block sizes of two or four and no stratification. Participants, treating clinicians, investigators, study personnel and outcome assessors remained blinded to treatment allocation throughout the randomized phase of the trial.
This study enrolled individuals who initiated ART during confirmed primary HIV infection or during early HIV infection and remained on suppressive ART for at least 1 year. Primary infection was defined according to standard clinical and laboratory criteria at the time of diagnosis, as detailed in the RIO clinical protocol. Specifically, the estimated time of primary infection was determined by one of six criteria: (1) positive HIV-1 serology within 24 weeks of a documented negative HIV-1 serology result, with the estimated infection date defined as the midpoint between the negative and positive tests; (2) the date of a positive p24 antigen result, with or without a negative HIV antibody test, depending on local laboratory reporting; (3) the date of a negative HIV antibody test with detectable HIV RNA or proviral DNA; (4) a Public Health England Recent Infection Testing Algorithm result reported as ‘Incident,’ indicating antibody avidity consistent with infection within the preceding 16 weeks, with the estimated date of infection defined as 2 months before the incident test result, with the Asanté HIV-1 Rapid Recency Assay also permitted for recency testing; (5) the date of a weakly reactive or equivocal fourth-generation HIV antibody/antigen test; or (6) the date of an equivocal or reactive antibody test with fewer than four bands on western blot. Early-stage infection was operationally defined as ART initiation before substantial immune compromise, using a nadir CD4+ T cell count >500 cells per µl as a pragmatic surrogate for early disease stage.
Additional inclusion criteria included age 18–60 years, ability to provide informed consent including consent to long-term follow-up; willingness to comply with study visits and blood sampling; initiation of ART within 6 months of estimated primary HIV infection or during early HIV infection; virological suppression on ART for at least 1 year, with a single HIV-1 RNA measurement >50 but <500 copies per ml permitted during this period; no evidence of viral insensitivity to either 10-1074-LS or 3BNC117-LS; current CD4+ T cell count >500 cells per ml or CD4:CD8 ratio >1.0; nadir CD4+ T cell count >250 cells per µl for participants diagnosed with confirmed primary HIV infection; receipt of an integrase inhibitor (INSTI)- or boosted protease inhibitor (PI)-based ART regimen at randomization, with participants receiving a non-nucleoside reverse transcriptase inhibitor required to have switched to an INSTI- or boosted PI-based regimen at least 4 weeks before randomization; adequate hemoglobin (≥12 g dl−1 for males or ≥11 g dl−1 for females), body weight ≥50 kg; hepatitis B and C screening consistent with protocol eligibility (hepatitis B virus surface antigen or hepatitis B virus DNA negative and hepatitis C virus antigen or hepatitis C virus RNA negative or anticore antibody negative); absence of significant comorbidities; and SARS-CoV-2 vaccination at least 4 weeks before enrollment. Females capable of becoming pregnant were additionally required to use protocol-defined effective contraception or complete abstinence from at least 2 weeks before the first bNAb/placebo infusion until 20 months after the last bNAb infusion.
Exclusion criteria included significant cardiovascular disease, including previous ischemic heart disease (ST- or non-ST-elevation myocardial infarction, Q3-risk > 20, stable or unstable angina) or stroke; malignancy except squamous cell skin cancer; opportunistic infection or significant comorbidity or a comorbidity considered likely to occur during the trial, including malabsorption syndromes or autoimmune disease; contraindication to receipt of BHIVA-recommended combination ART; HTLV-1 co-infection; SARS-CoV-2 infection confirmed by RT–PCR up to 72 h before randomization/dosing where applicable according to local guidance; high risk of severe COVID-19 as determined according to applicable guidance and the participant’s physician; current or planned systemic immunosuppressive therapy (with inhaled and topical corticosteroids permitted); participation in another interventional trial of an experimental agent or a non-interventional study requiring additional blood draws, with observational studies permitted and non–clinical trials of investigational medicinal product studies involving minimal blood sampling considered on a case-by-case basis; history of severe reaction to antibody infusion or hypersensitivity to 3BNC117-LS, 10-1074-LS or their constituents or excipients; treatment with IV immunoglobulin or other monoclonal antibodies during the trial; clinically significant abnormal laboratory results including significant hepatic impairment with advanced fibrosis or cirrhosis with decompensation; alanine aminotransferase >5× the upper limit of normal; estimated glomerular filtration rate <60 ml per min per 1.73 m2; urine protein-to-creatinine ratio >30 mg mmol−1 or international normalized ratio >1.5; evidence of organ dysfunction or any clinically significant abnormality on physical examination or vital signs considered by the investigator to preclude enrollment; active alcohol or substance use likely to impair adherence; insufficient venous access; pregnancy or breastfeeding; or concern regarding risk-reduction precautions during ATI.
A total of 68 participants were enrolled between May 2021 and July 2024 as part of a two-stage clinical design. Clinical data and biospecimens used in this study were collected prospectively throughout trial follow-up between May 2021 and September 2025. Although the protocol permitted enrollment of both sexes, all participants enrolled in the trial were men, predominantly white. Participant disposition, including completion of follow-up, withdrawals and exclusions from specific analyses, is summarized in Extended Data Fig. 1. The RIO trial was powered for the primary clinical endpoint as described in the clinical paper38. Briefly, the study was designed to detect a reduction in the rebound rate at 36 weeks from 90% in arm B to 55% in arm A (hazard ratio 0.35), with 90% power at a 5% significance level. No formal power calculations were performed for the exploratory mechanistic analyses reported here. Sex and gender information were collected by self-report at study enrollment. Race and ethnicity information were self-reported according to local clinical site procedures. Because all enrolled participants were men, sex- and gender-based analyses were not performed. Participants received financial compensation for each visit. Blood samples were collected at baseline and at multiple time points following 3BNC117-LS and 10-1074-LS or placebo infusions. Samples were processed briefly after collection, with serum and plasma stored at −80 °C. PBMCs were isolated by density gradient centrifugation. The PBMC number was determined either manually or using an automated cell counter (Vi-Cell XR; Beckman Coulter), and cells were cryopreserved in liquid nitrogen in fetal bovine serum supplemented with 10% dimethyl sulfoxide.
Definitions of virological control and ART-free status
Virological control was defined as sustained plasma HIV-1 RNA <1,000 copies per ml during treatment interruption. ART restart criteria were defined per protocol as either (1) two consecutive plasma HIV-1 RNA measurements > 105 copies per ml or (2) six consecutive plasma HIV-1 RNA measurements > 103 copies per ml. In addition to these virological criteria, ART could be restarted for other predefined clinical or participant-driven endpoints not meeting the above thresholds, including participant preference or clinician judgment. All ART restart events and their classification were adjudicated by an independent Endpoint Adjudication Committee. The distribution of ART restart outcomes by study arm is summarized in Extended Data Table 1.
Intact proviral DNA analysis
The frequency of CD4+ T cells harboring intact, 5′-deleted and 3′-deleted proviruses was determined using a ddPCR assay modified from the Intact Proviral DNA Assay10. Briefly, CD4+ T cells were enriched from PBMCs using a negative immunomagnetic selection kit (Miltenyi Biotec). Genomic DNA was extracted using the QIAamp DNA Mini Kit (Qiagen) according to the manufacturer’s instructions. DNA concentrations were quantified using the Qubit 3.0 Fluorometer with the Qubit dsDNA BR Assay Kit (Thermo Fisher). Samples were from the preinfusion time point and obtained from an aviremic time from a minimum of 6 weeks before rebound, when HIV-1 RNA was <20 copies per ml.
For ddPCR, two sets of primers and probes specific to the HIV gag and env regions, along with two fragments of the housekeeping gene RPP30, were utilized in separate reactions77. HIV quantification was performed using 750 ng of genomic DNA per sample with the following primers and probes for the HIV gag region: forward (5′-GACTAGCGGAGGCTAGAAGGAGAGA-3′), reverse (5′-CTAATTCTCCCCCGCTTAATAYTGACG-3′) and probe (5′-6FAM-ATGGGTGCGAGA-IABkFQ-3′). For the HIV env region: forward (5′-AGTGGTGCAGAGAGAAAAAAGAGC-3′), reverse (5′-GTCTGGCCTGTACCGTCAGC-3′) and probes (5′-VIC-CCTTGGGTTCTTGGGA-MGB-3′ and an unlabeled hypermutated probe 5′-CCTTAGGTTCTTAGGAGC-MGB-3′). An alternative primer/probe set targeting the PS region was used as a backup: forward (5′-CAGGACTCGGCTTGCTGAAG-3′), reverse (5′-GCACCCATCTCTCTCCTTCTAGC-3′) and probe (5′-6FAM-TTTTGGCGTACTCACCAGT-IABkFQ-3′)10. To measure input cell numbers and correct for DNA shearing, 7.5 ng of DNA was used with RPP30 primers and probes (RPP30-1: forward (5′-GATTTGGACCTGCGAGCG-3′), reverse (5′-GCGGCTGTCTCCACAAGT-3′), probe (5′-6FAM-TTCTGACCTGAAGGCTCTGCGC-IABkFQ-3′); RPP30-2: forward (5′-GTGTGAGTCAATCACTAGACAGAA-3′), reverse (5′-AAACTGCAACAACATCATAGAGC-3′), probe (5′-HEX-AGAGAGCAACTTCTTCAAGGGCCC-IABkFQ-3′). Four technical replicates were performed per sample. Positive and negative controls were included in each reaction.
The ddPCR assays were conducted using the Bio-Rad QX200 AutoDG system with the ddPCR Supermix for Probes (no dUTPs) (Bio-Rad). Thermal cycling conditions included an initial denaturation at 95 °C for 10 min, followed by 45 cycles of 94 °C for 30 s and 59 °C for 1 min, with a 2 °C s−1 ramp rate. A final extension was performed at 98 °C for 10 min, followed by a hold at 12 °C. The results were adjusted for DNA shearing using the ratio of double-positive RPP30 partitions and normalized to 106 CD4+ T cells.
Q4PCR
The Q4PCR assay was conducted to characterize the composition of the reservoir, as previously described11. Briefly, total CD4+ T cells were enriched from cryopreserved PBMCs using a negative immunomagnetic selection kit (Miltenyi Biotec). Genomic DNA was extracted from CD4+ T cells using the Gentra Puregene Cell Kit (Qiagen), and DNA concentration was measured using the Qubit dsDNA BR Assay Kit (Thermo Fisher).
A total range of 1 to 10 × 106 CD4 T cells were screened per participant. An initial outer PCR (near full length, step 1 (NFL1)) was performed on genomic DNA at a single-copy dilution using the outer primers BLOuterF (5′-AAATCTCTAGCAGTGGCGCCCGAACAG-3′) and BLOuterR (5′-TGAGGGATCTCTAGTTACCAGAGTC-3′)78. A 1-µl aliquot of the undiluted NFL1 PCR product was then subjected to a Q4PCR reaction, utilizing four primer–probe sets targeting conserved regions of the HIV-1 genome: PS: forward (5′-TCTCTCGACGCAGGACTC-3′), reverse (5′-TCTAGCCTCCGCTAGTCAAA-3′), probe (5′-/Cy5/TTTGGCGTA/TAO/CTCACCAGTCGCC-3′/IAbRQSp); env: forward (5′-AGTGGTGCAGAGAGAAAAAAGAGC-3′), reverse (5′-GTCTGGCCTGTACCGTCAGC-3′), probe (5′-/VIC/CCTTGGGTTCTTGGGA-3′/MGB); gag: forward (5′-ATGTTTTCAGCATTATCAGAAGGA-3′), reverse (5′- TGCTTGATGTCCCCCCACT-3′), probe (5′-/6-FAM/CCACCCCAC/ZEN/AAGATTTAAACACCATGCTAA-3′/IABkFQ); and pol: forward (5′-GCACTTTAAATTTTCCCATTAGTCCTA-3′), reverse (5′-CAAATTTCTACTAATGCTTTTATTTTTTC-3′), probe (5′-/NED/AAGCCAGGAATGGATGGCC-3′/MGB). Quantitative PCR was performed under the following thermal cycling conditions: an initial denaturation at 94 °C for 10 min, followed by 40 cycles of 94 °C for 15 s and 60 °C for 60 s. Quantitative PCR assays were conducted in a 384-well plate format using the Applied Biosystem QuantStudio 6 or 7 Flex real-time PCR system. Data analysis was performed using Thermo Fisher Design and Analysis Software 2.4.3. Samples that exhibited reactivity with two or more of the four probes were selected for a nested PCR (NFL2).
The NFL2 reaction was performed on undiluted 1-µl aliquots of the NFL1 PCR product. Each reaction was conducted in a 20-µl volume using Platinum Taq high-fidelity polymerase (Thermo Fisher) and the primers 3LTRi (5′- TCAAGGCAAGCTTTATTGAGGCTTAA-3′) and U5-638F (5′- GCGCCCGAACAGGGACYTGAAARCGAAAG-3′)19. The thermocycler conditions for NFL2 were the same as those used for the NFL1 PCR. Library preparation and sequencing were conducted as previously described11.
HIV-1 sequence assembly and annotation
HIV-1 genome reconstruction was performed using an in-house pipeline, Defective and Intact HIV Genome Assembler, designed for assembling raw sequencing reads into annotated HIV genomes25. The pipeline includes rigorous quality control steps to enhance accuracy and reliability. First, quality control checks were conducted to remove PCR-amplified reads and correct sequencing errors using clumpify.sh from the BBtools package v38.72 (http://sourceforge.net/projects/bbmap). Next, adapter sequences and low-quality bases were trimmed, and potential contaminant reads were removed using the Trim Galore package v0.6.4 (https://github.com/FelixKrueger/TrimGalore). HIV-1 sequences were assembled using SPAdes v3.13.0, and the longest assembled contig was aligned to the HXB2 HIV-1 reference genome via BLAST79. Sequences exhibiting double peaks—regions indicating the presence of two or more viral variants within a sample (defined by a consensus identity cut-off of <70% for any residue)—or samples with an insufficient number of sequencing reads (≤500 reads) were excluded from downstream analyses.
Sequences that did not meet the double-peak criteria (consensus identity for any residue <70%) were further classified as either intact or defective proviruses. Only intact HIV-1 env sequences were considered for subsequent analyses.
Single-genome amplification of plasma rebound virus env genes
Sequencing of HIV-1 plasma rebound env genes was performed as previously described80. In brief, HIV-1 RNA was extracted from viremic plasma samples using the MinElute Virus Spin kit (Qiagen) according to the manufacture’s recommendation. First-strand cDNA synthesis was carried out using SuperScript III reverse transcriptase (Invitrogen) and an antisense primer, envB3out (5′-TTGCTACTTGTGATTGCTCCATGT-3′) for subtype B or OFM19 (5′-GCACTCAAGGCAAGCTTTATTGAGGCTTA-3′) for subtype C. To ensure single-genome amplification, cDNA was endpoint diluted according to Poisson distribution, achieving <30% of wells yielding a PCR product. The envelope gene was then PCR-amplified using subtype B primers envB3out and envB5out (5′-TAGGCATCTCCTATGGCAGGAAGAAG-3′) or subtype C primers OFM19 and Vif1 (5′-GGTTTATTACAGGGACAGCAGAG-3′). A second round of PCR was performed using 1 µl of the first-round PCR product as a template, with subtype B primers envB3in (5′-GTCTCGAGATACTGCTCCCACCC-3′) and envB5in (5′-TAGGCATCTCCTATGGCAGGAAGAAG-3′) or subtype C primers env A (5′-GGCTTAGGCATCTCCTATGGCAGGAAGAA-3′) and env N (5′-CTGCCAATCAGGGAAGTAGCCTTGTGT-3′). PCR amplifications were conducted using High Fidelity Platinum Taq (Invitrogen) under the following conditions: an initial denaturation at 94 °C for 2 min, followed by 35 cycles of 94 °C for 15 s, 55 °C for 30 s and 68 °C for 4 min, with a final extension at 68 °C for 10 min. PCR products of the expected size were subjected to library preparation and sequencing using the Illumina MiSeq platform.
Sequence and phylogenetic analysis
Nucleotide alignments of intact env sequences were performed using Muscle v5.1 with the PPP algorithm81. Sequences containing premature stop codons, truncations or frameshift mutations were excluded from further analyses. Maximum-likelihood phylogenetic trees were generated from these alignments using FastTree 2.1.11 with the GTR model and 1,000 bootstrap replicates82.
Pseudotyped-virus production
Selected single-genome sequences from CD4+ T cell reservoir or plasma rebound samples were used as templates to produce pseudoviruses from a cytomegalovirus (CMV) promoter as described83. The CMV promoter was amplified by PCR from pcDNA 3.1 (Life Technologies) using the primers CMVenv (5′-AGTAATCAATTACGGGGTCATTAGTTCAT-3′) and CMVenv1A (5′-CATAGGAGATGCCTAAGCCGGTGGAGCTCTGCTTATATAGACCTC-3′). Thermocycling conditions were 94 °C for 2 min, followed by 30 cycles of 94 °C for 30 s, 55 °C for 30 s and 68 °C for 4 min. A 1-µl aliquot of the second-round PCR product from NFL amplification (reservoir) or single-genome amplification (rebound) was used as a template for env to which we added CMV overhanging regions using the forward primer ENVfwd (5′-CACCGGCTTAGGCATCTCCTATGGCAGGAAGAA-3′) and the reverse primer envB3in or ENV N, depending on the subtype. The CMV promoter amplicon was fused to individual env genes via overlapping PCR with 10 ng of env and 0.5 ng of CMV using CMVenv primer and envB3in or ENV N as the reverse primer. Thermocycling conditions were 94 °C for 2 min followed by 20 cycles of 94 °C for 30 s, 55 °C for 30 s, 68 °C for 4 min, followed by a final extension at 68 °C for 10 min. All PCR reactions were carried out using Platinum Taq HiFi polymerase. Resulting amplicons were analyzed by gel electrophoresis, purified using the Macherey-Nagel gel and PCR purification kit and cotransfected with the pSG3Δenv vector (National Institutes of Health AIDS Reagent Program) into 293T cells to produce pseudoviruses as previously described.
Neutralization assays
Viruses were tested against bNAbs and purified autologous IgGs using the TZM-bl cell neutralization assay with cells obtained through the National Institutes of Health HIV Reagent Program, as previously described47,84. Briefly, pseudoviruses were incubated with eight fivefold serial dilutions of antibodies for 1 h at 37 °C in 96-well plates before addition of 10,000 TZM-bl cells per well in growth medium containing DEAE-dextran. Cells were incubated for 48 h at 37 °C in 5% CO2, after which infection was quantified by measuring luciferase activity using Bright-Glo reagent (Promega). Neutralization was calculated relative to virus-only control wells, and IC values were determined by nonlinear regression. Assays were performed in duplicate under Good Clinical Laboratory Practice quality assurance standards. For bNAb testing, the starting antibody concentrations were 50 μg ml−1 for 3BNC117 and 10-1074, and purified autologous IgG was tested at an initial concentration of 500 μg ml−1 followed by eight fivefold serial dilutions. Pseudovirus clones derived from both the reservoir and rebound were tested. For autologous antibody testing, baseline IgG was purified using Protein G Sepharose 4 Fast Flow (GE Life Sciences). Neutralization breadth was evaluated using a panel of ten HIV-1 env pseudoviruses selected based on reported resistance to both 3BNC117 and 10-1074 (https://www.hiv.lanl.gov/catnap). The panel included the following env clones: 700010040.C9.4520, H030.7, H086.8, THRO4156.18, H035.18, H704_1109_140_RE_cs, 191955_A11, 89-F1_2_25, 6322.V4.C1 and 3637.V5.C3.
Depletion of residual bNAbs from longitudinal IgG samples
To remove residual bNAbs from longitudinal IgG samples, anti-3BNC117 and anti-10-1074 antibodies engineered with a FLAG epitope on the light chain were used as capture reagents. Following IgG purification from plasma, samples were incubated with the FLAG-tagged anti-bNAb-idiotype reagents at a twofold molar ratio of the anti-idiotype to the estimated bNAb concentration for 2 h at 4 °C to allow immune complex formation. Samples were then incubated overnight at 4 °C with anti-FLAG M2 magnetic beads (Sigma-Aldrich, catalogue number M8823). Beads were removed magnetically, and the supernatant (depleted of infused bNAbs) was collected, tested for residual bNAbs by ELISA and, if below the limit of detection, used for downstream autologous neutralization assays. Depletion was repeated if residual bNAb was detected until it no longer was.
Time-to-event analyses
To evaluate the combined influence of endogenous and therapeutic antibody pressure on time to ART restart, time-to-event analyses were performed using Cox proportional hazards models with time to ART restart as the outcome. Cox proportional hazards analyses incorporated observed ART restart events occurring beyond 96 weeks when available. Baseline reservoir sensitivity to autologous antibodies, 10-1074 and 3BNC117 was quantified using IC80 values, which were log10-transformed and standardized before modeling. Univariable, pairwise (models including two resistance variables simultaneously) and multivariable models were fit to assess the individual and combined contributions of each resistance dimension to rebound timing. Hazard ratios reflect the effect of a one-standard-deviation increase in resistance. Analyses were performed using Cox proportional hazards regression in GraphPad Prism and R (survival package version 3.8-6).
Statistics and reproducibility
Statistical analyses were performed using GraphPad Prism version 10.6.1 (GraphPad Software) and R version 4.5.0 (R Foundation for Statistical Computing), as described for each analysis. All statistical tests were two-sided unless otherwise specified. Exact statistical tests, sample sizes, measures of central tendency and definitions of biological replicates are provided in the corresponding figure legends. No statistical method was used to predetermine sample size for laboratory analysis because sample size was determined by participant enrollment and sample availability within the RIO clinical trial. No data were excluded from the analyses unless explicitly stated. Statistical analyses of prespecified secondary and exploratory outcomes were conducted according to the trial Statistical Analysis Plan. Analyses not prespecified in the Statistical Analysis Plan are explicitly identified in ‘Results’ as non-prespecified exploratory or post hoc analyses. Participants were randomized as part of the RIO clinical trial according to the study protocol. Laboratory investigators performing the mechanistic analyses were initially blinded to treatment allocation. Blinding was maintained until participants met protocol-defined criteria for unblinding (for example, following viral rebound), after which treatment allocation became known for subsequent analyses. Each participant was considered one biological replicate unless otherwise indicated, and technical replicates were not treated as independent observations. Correlation analyses were performed using two-sided Spearman rank correlation coefficients with 95% confidence intervals. Group comparisons were performed using two-sided Mann–Whitney tests or Wilcoxon matched-pairs signed-rank tests, as appropriate. Time-to-event analyses were evaluated using Cox proportional hazards regression. Statistical significance was assessed using exact two-sided P values, which are reported in the figures or text.
Reporting summary
Further information on research design is available in the Nature Portfolio Reporting Summary linked to this article.



