
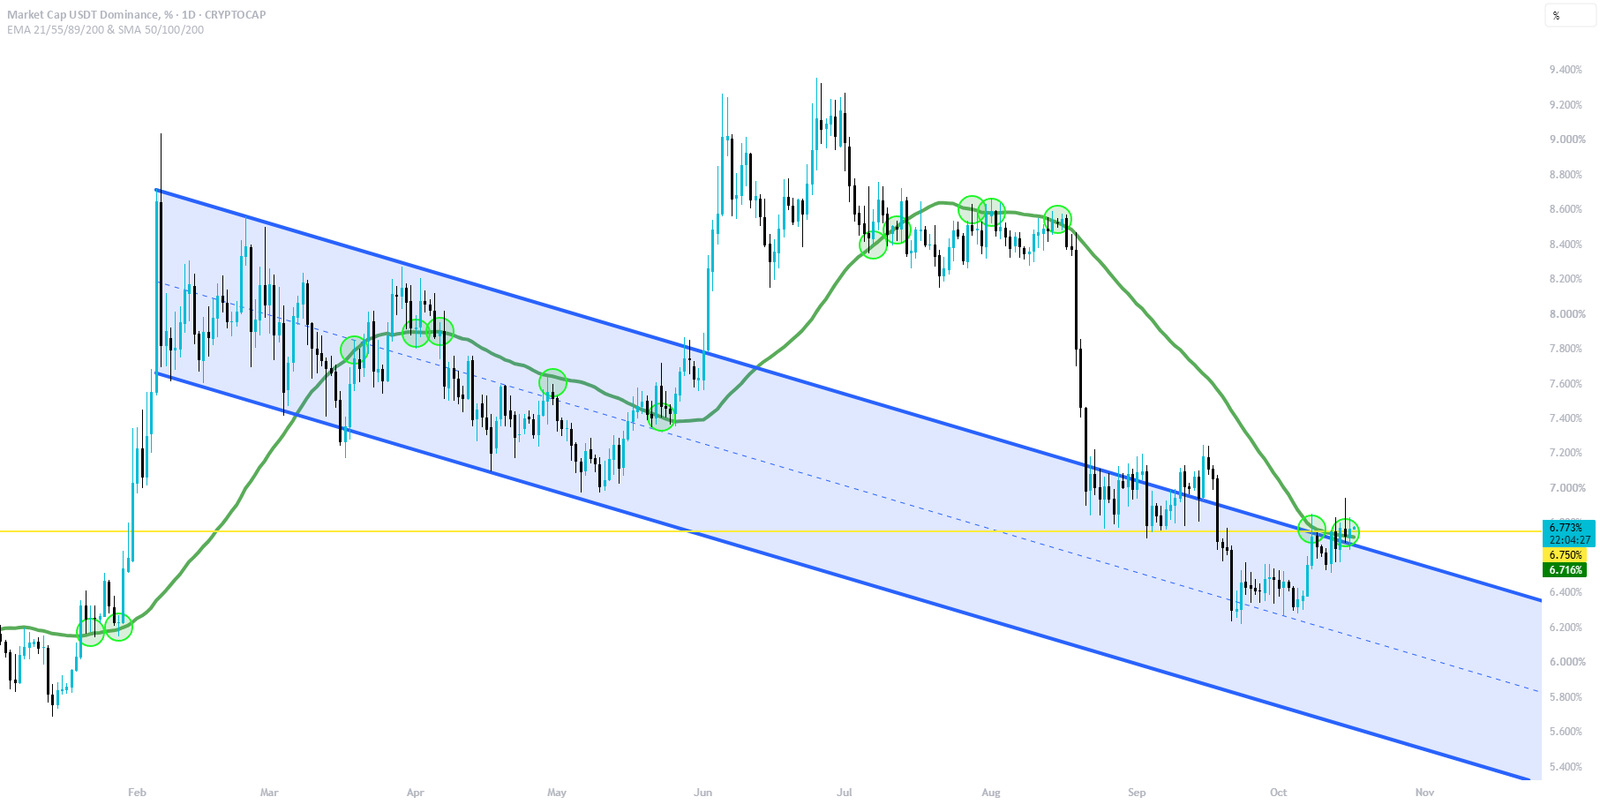
The 6.75% Level
To understand the structure on the chart, and why the yellow ray around 6.75% matters so much, please review my last idea:
Right now Tether dominance is back at this level, and so far every daily candle body has closed below it, so it is acting as resistance. This suggests market participants are using the level to distribute their cash into crypto, which could lead to a major crypto uptrend beginning soon. If dominance does top out here, it could drop as low as 5.5%, which would be a huge swing to the upside for crypto.
The 50 SMA
There is one other level to watch, the 50 SMA (green). It has been a major level for much of USDT.D’s history, and I have marked the important retests with green circles. Dominance is currently trading above it and trying to use it as a floor. If dominance holds the 50 SMA and cannot break back below it, the target to the upside is 8.15% to 8.25%, which would cause a major crypto pullback as participants rush out of crypto and back into the security of cash.
Which Way It Breaks
For now, dominance can break either way, so I wanted to outline both scenarios. It will pick a side over the next couple of days which will give you a clear read on crypto’s next major move.
Based on my recent analysis across the crypto markets, I lean toward USDT.D getting rejected from the yellow line and crypto moving higher, but be prepared for the alternate scenario if the 50 SMA holds.



