
Human subjects research
The study was conducted according to Declaration of Helsinki principles and was approved by the Institutional Review Board of MD Anderson Cancer Center (MDA protocol nos. 2025-1294, 2022-0042 and 2005-0656). Stanford biospecimen collection, flow cytometry analysis and clinical data collection were approved under Stanford protocol no. CCT5019 approved by the Stanford Institutional Review Board. For molecular correlative analysis, written informed consent was received from participants prior to inclusion in the study for biological sample collection, clinical data collection and genomic data analysis (MDA IRB no. 2005-0656 and Stanford IRB no. CCT5019). No compensation was provided for study participation. Retrospective population-level analysis using standard-of-care clinical data was performed under MDA protocol no. 2022-0042 with a waiver of informed consent. Patient-level data was harvested manually from the electronic medical record except for ALC data, which was harvested using the EPIC slicer-dicer function.
Patient population
In a population of 160 patients receiving cilta-cel infusions between July 2022 and October 2025, we identified 17 patients with possible IEC-EC who underwent endoscopy (Extended Data Table 1 and Extended Data Fig. 1a). Of these patients, 16 were identified prospectively and 1 was identified retrospectively. In total, 159 cilta-cel infusions occurred at MD Anderson, and 1 infusion occurred at a collaborating institution. Of the 159 infusions at MD Anderson, 158 were consecutive between July 2022 and August 2025. The one additional patient with concern for IEC-EC received non-consecutive infusions in October 2025; this patient did not have CAR+ cell infiltrate and was used as a negative control. The one outside referral showed CAR+ PTCL, had an initial concern for IEC-EC and lacked CAR+ infiltration in the GI tract and was therefore used as a negative control and independent case report. This patient had been treated with cyclophosphamide, hydroxydaunorubicin, oncovin and prednisone for a CAR+ T cell lymphoma prior to GI biopsy.
Sex reporting
Biological sex is recorded per electronic medical record. Gender is not reported in the manuscript. Sex was not considered in the study design.
Statistics and reproducibility
Detailed statistical analysis is documented below. Unless otherwise stated, all tests are two sided and all CIs are calculated at 95%. Statistical analysis was performed under supervision of the MD Anderson Department of Biostatistics. N value was determined by total number of available patients or samples. No statistical method was used to predetermine sample size. Sample size was limited by the total number of patients treated with CAR-T and the total number of patients with concern for the the IEC-EC pathology within the treated population. The experiments were not randomized. The investigators were not blinded to allocation during experiments and outcome assessment. Statistical tests were performed on biological replicates; no technical replicates were used in this study.
Data exclusions
The incidence analysis was restricted to the 158 patients in the consecutive treatment cohort, excluding two patients treated outside that cohort to avoid selection bias. For tissue analyses requiring CD3-based cell classification or CAR-positive fractions among T cells, biopsies with failed or technically inadequate CD3 staining were excluded because a reliable CD3-positive denominator could not be established (n = 3 biopsies in seqIF panel 2: one ileum, one colon, one stomach). These biopsies could remain eligible for analyses of markers that did not depend on CD3 staining, when technically evaluable. Where applicable in flow data, patients or timepoints were excluded if sample density or quality was insufficient for meaningful data acquisition. This includes AUC calculations requiring ≥2 D0–30 datapoints and CD4 and CD8 measurements requiring ≥5 CAR+ cells per microliter.
Sequencing library generation
Genomic sequencing libraires (RNA-seq, TCR-seq, WES, WGS and scRNA-seq) were prepared from tissue and sequenced at MedGenome/Signos Bio. Signos Bio also assisted in sequencing library quality control (QC) and alignment bulk RNA-seq. All other alignments and analysis were performed at MD Anderson.
Use of large language models
Large language models (LLMs) were used to assist in supervised code generation using institutionally approved software (Copilot) in a contained environment. LLMs were additionally used for copy editing and phrasing.
GI biopsy acquisition
Upper GI (stomach and duodenum) and lower intestinal (terminal ileum and colon) biopsy specimens were collected as part of routine clinical care and processed according to standard institutional pathology procedures. Multiple biopsy fragments were obtained from each anatomic site and submitted for histopathologic evaluation. Specimens designated for morphologic assessment were fixed in 10% neutral-buffered formalin, routinely processed and embedded in paraffin. Sections stained with hematoxylin and eosin were prepared for histopathologic evaluation, and additional unstained sections were obtained for immunohistochemical studies, including CAMELID VHH IHC. Additional sections were also collected for seqIF studies. Additional fresh biopsy fragments, specifically from the duodenum and terminal ileum, were collected for flow cytometric analysis. These specimens were placed immediately in RPMI medium and submitted to our clinical flow cytometry laboratory, where they were processed into single-cell suspensions and analyzed using standard clinical flow cytometric procedures. Where applicable, research specimens from GI biopsies were obtained with written informed consent under MDA protocol no. 2005-0656 and Stanford protocol no. CCT5019.
Detailed clinical summary of IEC-EC cases
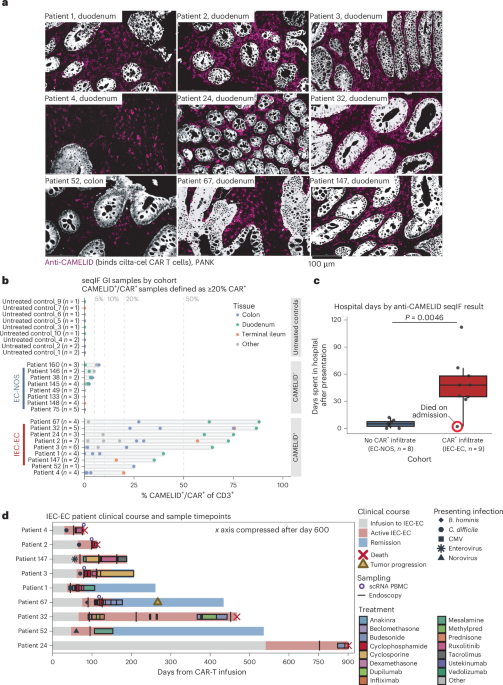
Although the median onset of cases was day +61, one patient had symptoms that began near day +541 and was evaluated at approximately day +700 at an outside facility (Supplementary Fig. 2b). We subsequently confirmed CAR+ infiltration by seqIF analysis. This patient unfortunately died of infection shortly after starting pulse steroids for IEC-EC. Such late presentation is rare, but this finding indicates that standard-of-care cilta-cel-treated patients remain at continuous risk for severe complication potentially for years after infusion.
Patients frequently had preceding infections prior to development of IEC-EC. These infections were commonly GI infections, and treatment initiation for known GI infections delayed IEC-EC workup in four cases. Infection prior to IEC-EC diagnosis was noted in seven of nine patients (77.8%), three Clostridioides difficile, one Blastocystis hominis, one enterovirus, one cytomegalovirus reactivation and one norovirus). Similarly high rates of preceding infection have been noted in prior descriptions of CAR+ T cell neoplasms after cilta-cel6. In some cases, the preceding infection was C. difficile DNA detection with negative endotoxin, but all received antibiotic treatment for C. difficile.
Patients received diverse IEC-EC-directed treatments reflecting evolving therapeutic paradigms as our institutional understanding of the disease pathology advanced. The median number of unique agents used per patient was 6 (range 1–7), and treatment was started a median of 27 days after symptom onset. Steroids, typically prednisone or dexamethasone, were used in 7 patients at a median of 31 days after symptom onset without effective disease control (median of 6 days on steroids, range 2–34 days). Locally mesalamine and budesonide were used in 8 patients for a median of 73 days (range 13–218 days). Immune suppression in the form of infliximab and ustekinumab was used in Patient 32. These medications improved symptoms; however, subsequent longitudinal staining of GI biopsies from day +217 and day +457 showed the patient continued to have CAR+ T cell infiltration. The patient died of an infection on day +468 (Supplementary Fig. 2c).
Two patients received ruxolitinib as a primary agent and one patient as a maintenance agent (Supplementary Figs. 1c, 2a and 3c). Neither patient treated with ruxolitinib as primary therapy responded, and one died of hemorrhagic C. difficile infection. The patient for whom ruxolitinib was used as maintenance, after intravenous (IV) cyclosporine-induced remission, eventually had IEC-EC relapse on oral ruxolitinib (Supplementary Fig. 4a). One additional patient was treated with ruxolitinib in conjunction with cyclophosphamide, and this patient went into durable remission (Supplementary Fig. 1a).
The major agents that led to disease remission at our institution were T cell directed therapies with either cyclophosphamide or calcineurin inhibitors. Four patients were treated with cyclophosphamide doses ranging from 1 to 2 g m− 2. Two patients had rapid responses after cyclophosphamide (Supplementary Figs. 1a, 3b and 4b; one in combination with ruxolitinib). Neither experienced relapse of IEC-EC, although one had subsequent myeloma relapse. One patient treated with cyclophosphamide had symptomatic improvement but died shortly afterward of infection, with cyclophosphamide immune suppression as a likely contributor to mortality (Supplementary Fig. 1b). A fourth patient did not respond to cyclophosphamide (Supplementary Fig. 1c).
In two cases, patients were treated with the calcineurin inhibitor cyclosporine, which was previously reported as effective in IEC-EC5 (Supplementary Figs. 1c and 3c). In both cases, patients had prompt responses, including Patient 3, who had failed to respond to multiple agents including cyclophosphamide. In Patient 147, IV cyclosporine induced a complete clinical response, but we were unable to maintain sufficient plasma levels on oral cyclosporine. The response to IV cyclosporine was confirmed with biopsies that showed a reduction of BCMA+ CAR infiltration from 25% of CD3+ cells to 5% of CD3+ cells as demonstrated by clinical flow cytometry. The patient was ultimately discharged on oral ruxolitinib but relapsed with re-expansion of the CAR+ population to 27% of BCMA+ CAR, again shown by clinical flow cytometry (Supplementary Fig. 4a). They were subsequently transitioned to tacrolimus with clinical response.
Patient 24 was diagnosed nearly 700 days post-infusion and treated outside of MD Anderson with only steroids. This patient unfortunately presented in cardiac arrest due to polymicrobial bacteremia shortly after starting treatment (Supplementary Fig. 2b). Finally, in a single IEC-EC case, Patient 52 was treated only with mesalamine as an IEC-EC-directed therapy. This patient subsequently improved without additional treatment (Supplementary Fig. 3a).
Overall, these results demonstrate that CAR+ IEC-EC is a diverse disease with a range of presentations. Most cases at our institution were severe, led to prolonged hospitalization and resulted in high morbidity and mortality. Presentations were typically within the first 6 months of CAR T cell infusion, but at least one patient was diagnosed nearly 2 years after infusion. Significant variability was seen in response between patients, with several cases being refractory to multiple treatments.
IHC
Immunohistochemical staining was performed on the Leica Bond III (Leica Biosystems). Following deparaffinization and rehydration of 4–5 μm formalin-fixed paraffin-embedded (FFPE) tissue sections, antigen retrieval was performed at 100 °C for 20 min with an EDTA-based buffer, pH 9. Endogenous peroxidase was blocked with 3% peroxide for 5 min. Primary anti-CAMELID VHH antibody (1:100, Abnova, cocktail monoclonal antibody) was applied for 60 min. Primary antibody detection was carried out using a commercial polymer system (Bond Polymer Refine Detection, Leica Biosystems) for 8 min, and staining development was achieved by incubation with DAB for 10 min and DAB Enhancer for 5 min (Leica Biosystems).
Validation
CAMELID staining was initially validated as a single immunostain using a series of appropriate positive and negative control specimens. Positive controls consisted of BM samples from patients treated with BCMA CAR T cells, and negative controls included BM specimens expected to lack the target signal. This validation was performed in our Clinical Laboratory Improvement Amendments (CLIA) IHC laboratory. Following initial validation, CAMELID staining was incorporated into a multiplex panel using the COMET (Lunaphore) platform, where assay performance was further evaluated using positive and negative controls.
Sequential multiplex immunofluorescence
FFPE slides were deparaffinized, rehydrated and subjected to heat-induced antigen retrieval using the EZ-Retriever system (BioGenex, cat. no. MW014-MO) in EDTA buffer (BioGenex, cat. no. HK547-XAK) at 107 °C for 15 min. After cooling to room temperature for 30 min, slides were washed three times in 1× phosphate-buffered saline (PBS) and stored hydrated in 1× PBS at room temperature until use.
For automated staining, slides were mounted on the COMET platform (Lunaphore) with a 12.5 mm × 12.5 mm microfluidic chip sealing the chamber. Reagents were prepared per manufacturer protocol and loaded into the system: Multistaining Buffer (Lunaphore, cat. no. BU06), Elution Buffer (Lunaphore, cat. no. BU07-L), Imaging Buffer (Lunaphore, cat. no. BU09), Quenching Buffer (Lunaphore, cat. no. BU08-L) and 70% ethanol. Primary and secondary antibodies (Alexa Fluor, cat. no. 555/647) were diluted in Multistaining Buffer at optimized concentrations, stored at 4 °C and dispensed automatically via COMET Control software. Prior to incorporation into the full panel, each primary antibody was optimized through systematic concentration titration at the manufacturer-recommended, one-half and one-quarter concentrations to maximize the signal-to-noise ratio, and fluorophore-channel assignments were optimized to minimize spectral overlap and bleed-through. Secondary-antibody-alone testing was also performed for each antibody to confirm the absence of nonspecific secondary binding. The platform processed two slides simultaneously, executing 20-plex panels within 20–24 h. For a more detailed explanation, refer to ref. 20.
Upon completion of all cycles, the COMET Control software generated a multilayer OME-TIFF file. Images were exported from the platform after background subtraction by Horizon Viewer, which performs pixel-by-pixel subtraction of the background channel from the marker channel, normalized for the respective exposure times.
A second panel was performed on a subset of cases to further characterize these samples, using the same staining, imaging and background subtraction workflow described above. The panel 2 antibody list is provided below. Exact antibodies used for seqIF are documented in Supplementary Tables 7 and 8.
seqIF image analysis
Image analysis was performed using Visiopharm Inc. (version 2025.08.6 ×64; Hoersholm). Detection of GI tissue was performed using a random forest classifier on the DAPI stain. Areas with necrosis, poor focus, high autofluorescence or artifacts were excluded. Cell segmentation was achieved by detecting nuclei in the DAPI channel with a deep-learning U-Net model pretrained for nucleus segmentation; nuclear masks were then expanded to approximate whole-cell boundaries using biomarker-channel information. Parameters were optimized on representative training regions and then applied uniformly to all slides in batch mode to ensure reproducibility. Segmentation accuracy was verified by visual inspection of randomly selected fields (>95% concordance with manual counts). The PhenoPlex Guided Workflow in Visiopharm was subsequently used to define upper and lower intensity thresholds for positive-cell classification using a histogram-based thresholding approach. Cell intensity was calculated as the mean pixel intensity. Cell labels, mean fluorescence intensities and XY positions were exported for each image for downstream analysis in RStudio.
For CLDN9 analysis, epithelial tissue compartments were delineated using a deep-learning classifier (DeepLabv3+) trained on the PANK and DAPI channels to classify tissue as either PANK+ or background. The resulting classification was refined using morphological post-processing steps to remove noise and consolidate PANK+ regions. PANK+ regions were then converted to a region of interest to define the epithelial compartment. We further refined the epithelial compartments into CLDN9+ and CLDN9− regions using a decision forest classifier trained on the CLDN9 channel, with a 3 × 3 median filter applied. Regions smaller than 10 µm2 were excluded. The resulting labels were used to calculate the percent area positive for CLDN9 within the epithelial compartment for each image.
Histopathologic diagnosis of IEC-EC
IEC-EC was diagnosed based on the integration of histopathologic findings with immunophenotypic evidence demonstrating infiltration of BCMA+ CAR T cells within the GI tract, most prominently involving the duodenum and terminal ileum.
Histopathologic evaluation of endoscopic biopsies revealed a reproducible pattern of injury characterized by dense, albeit patchy, lymphoid infiltrates composed of small- to intermediate-sized lymphocytes with mild cytologic atypia and minimal architectural distortion of the lamina propria. Mild cytologic atypia refers to mildly enlarged lymphoid cells with slightly irregular nuclear contours. These infiltrates were most pronounced in the duodenum and terminal ileum. Additional mucosal abnormalities included villous blunting, crypt apoptosis, focal intraepithelial lymphocytosis and patchy eosinophilia.
Flow cytometric analysis was instrumental early in establishing the diagnosis by enabling detection of BCMA+ CAR T cells within GI tissue. We implemented a clinical protocol incorporating flow cytometry into the diagnostic evaluation of patients suspected of having IEC-EC. In parallel, we clinically validated a BCMA CAR-specific antibody (CAMELID) in our CLIA-certified IHC laboratory, allowing its incorporation into routine clinical workup. This antibody was subsequently titrated and optimized for seqIF to further characterize the spatial distribution and immunophenotype of CAR T cells within affected tissues.
Subsequent seqIF analyses indicated that a threshold of approximately 20% CAMELID+CAR+ T cells within the infiltrate was consistently observed in patients with IEC-EC, supporting CAMELID immunostaining as a practical diagnostic benchmark.
Control and normalization of seqIF data
Representative images from each marker are available via figshare25. We have included representative images for each marker across analyzed GI segments (duodenum, ileum, stomach, rectum, colon), including treated and untreated patients representing positive and negative controls, respectively.
In this multiplex immunofluorescence workflow, isotype controls were not included, as antibody specificity was instead assessed using orthogonal validation, assay optimization and internal negative controls. Internal negative controls are defined as cell types within the same tissue section that are not expected to express the target antigen and therefore should not show specific staining.
For the camelid VHH antibody, orthogonal IHC validation was performed on a Leica Bond III autostainer across 51 human FFPE specimens, including 13 BM and surgical samples previously characterized by flow cytometry for BCMA+ lymphocytes and 38 normal and neoplastic FFPE specimens expected to be negative. Staining results were concordant with orthogonal methods in positive samples, appropriately negative in control tissues (Extended Data Fig. 1b) and reproducible across six independent runs. Some nonspecific cross-reactivity of the VHH antibody was observed in normal plasma cells (Extended Data Fig. 1b). Plasma cells were identified morphologically and, when necessary, confirmed by CD138 immunostaining. Secondary-antibody-alone testing was also performed to confirm the absence of nonspecific secondary binding prior to incorporation into the workflow. CD138 staining is nearly absent after cilta-cel, limiting this as a source of background in relevant samples.
Within the seqIF workflow on the Lunaphore COMET platform, antibodies were optimized through systematic concentration titration at the manufacturer-recommended, one-half and one-quarter concentrations to maximize the signal-to-noise ratio (Extended Data Fig. 1c).
Fluorophore-channel assignments were optimized to minimize spectral overlap and bleed-through, and background fluorescence and autofluorescence were reduced using the Horizon Viewer pixel-wise background subtraction algorithm. A representative example of background subtraction is included in Extended Data Fig. 1d,e. It is important to note that, unlike in flow cytometry, where a detection threshold is defined between a negative and a positive reference population, thresholds in this imaging workflow were set based on the positive signal itself, with values falling below a defined detectable signal considered background. Taken together, the antibody titration, secondary-alone testing and pixel-wise background subtraction ensured that signal corresponding to an isotype control, as well as the secondary-alone condition, would fall below the detectable threshold following background correction.
Importantly, internal negative controls within the tissue sections further supported specificity assessment. Untreated control biopsies from patients not receiving CAR-T cell therapy served as negative biological controls for treatment-associated markers, such as camelid VHH staining, which was absent in these samples (images of untreated control biopsies can be found in Extended Data Fig. 1). In contrast, biopsies from CAR T cell-treated patients demonstrated the expected positivity in the relevant cellular types, consistent with the known biology and distribution of the target antigen.
Consistent with this, CD3 staining was restricted to T cells, and PANK staining was confined to epithelial cells; similarly, camelid VHH signal co-localized with CD3+ T cells and was absent from PANK+ epithelial cells. These spatially restricted patterns provided internal validation of staining specificity within each tissue section. Markers showing excessive background, incomplete elution between staining cycles or inconsistent localization during development were reoptimized or excluded from the final panel.
Analysis of CAR+ infiltration in seqIF data
Comparison of duodenum to other tissue
We analyzed seqIF biopsies restricted to IEC‑EC lesions. For each biopsy, we modeled the proportion of CAR+ T cells among CD3+ cells using the observed counts. GI sites were harmonized into categories (duodenum, terminal ileum, colon, stomach, rectum, esophagus). To account for overdispersion and within‑patient clustering (multiple biopsies per patient), we fit beta‑binomial GLMMs using glmmTMB v1.1.14 (ref. 39), including a random intercept for patient ID. Two site comparisons were performed: (1) duodenum versus each site (site as a multilevel factor) and (2) duodenum versus all other sites (collapsed binary factor). Marginal means and 95% Wald CIs on the response scale (% CAR+ of CD3+ cells), as well as OR contrasts on the logit scale, were obtained with emmeans v2.0.1 (ref. 40). For the multisite analysis, Benjamini–Hochberg false‑discovery‑rate adjustment was applied versus the baseline (duodenum). The collapsed binary comparison (duodenum versus all other tissues) was unadjusted. For all beta-binomial GLMM tests uniformity, dispersion, zero-inflation and outlier tests are non-significant (DHARMa41).
Comparison of CAR± and adjacent CAR− T cell fractions in the GI tissue in IEC-EC
Using patient-level mixed-effects models that account for repeat biopsies, we compared paired CAR+ and CAR− compartments within IEC-EC lesions. Models were fit for the fraction of each marker in the CAR+ and CAR− T cell population (such as PD1, GZMB, Ki-67). Patient ID was included as a random intercept and GI tissue category as an interacting variable. Patient-paired plots were generated to corroborate model-based findings across GI groups. Similar GLMM modeling was used to compare proportionate expression of T cell lineage markers, dividing T cell populations into four groups (CD4+CD8−, CD4−CD8+, DN, DP) and to compare CD103+ cells and fractional CD68 detection between the CAR+ patient cohort and the CAR− patient cohort.
Comparison of CD4/CD8 CAR± ratios
CD4 and CD8 ratios were described as the fraction of CAR+ cells expressing each marker by automated multiparameter IF. CD4/CD8 ratio is agnostic to DN and DP forms, which account for large fractions of the CAR+ T cell population in some patients. Total CD4/CD8 ratios per patient are reported descriptively along with fractions of DN and DP forms. Comparison of CAR+ T cells was performed using GLMM as described above.
Time-to-event analysis
We conducted time-to-event analyses for overall survival and progression-free survival using Kaplan–Meier (KM) estimation (R packages: survival v3.8-3 (ref. 42), survminer v0.5.1 (ref. 43)). Non-events were right-censored at last follow-up, two-sided log-rank tests were used for between-group comparisons (IEC-EC versus no IEC-EC), and we report point estimates at clinically relevant times alongside 95% CIs from the KM fits. To quantify surveillance time, we estimated median follow-up via the reverse KM method. For competing risks, we analyzed two settings: (1) NRM with progression as the competing event; and (2) IEC-EC cumulative incidence by 6 months, treating progression and death as competing events while capping follow-up at +183 days to generate a 6-month estimator. In both cases, we used cumulative incidence functions (cmprsk v2.2-12 (ref. 44)) and reported time-specific estimates.
Clinical flow cytometry to detect BCMA CAR T cells
Flow cytometric analysis was performed on fresh peripheral blood and tissue specimens using a standard stain/lyse/wash protocol (PharmLyse, BD Biosciences). The antibody panel included CD3, CD4, CD7, CD8, CD45, BCMA-CART and TRBC1. For BCMA-CART detection, the antibody is a phycoerythrin-labeled human BCMA protein/long peptide (amino-acid sequence 1–54) (AcroBiosystems, cat. no. BCA-HP2H7) that allows recognition of BCMA bound to CART cells. Cells were acquired on Lyric flow cytometers (BD Biosciences). Data were analyzed using FCS Express software (De Novo Software). This assay was CLIA certified at MD Anderson and was performed at standardized timepoints for cilta-cel-infused patients. The assay was also CLIA certified for detection of BCMA-CART in the GI tissue. Flow cytometry certification was completed on 08 February 2024; patients infused with cilta-cel prior to this time period did not have available flow cytometry data. The panel included the following antibodies from BD Biosciences (clone; cat. no.): anti-CD8–FITC (SK1; 340692), anti-CD4–PerCP–Cy5.5 (SK3; 341653), anti-CD19–PE–Cy7 (SJ25C1; 341103), anti-CD3–APC (SK7; 340440), anti-CD16–V450 (3G8; 644490), anti-CD56–V450 (B159; 560360) and anti-CD45–V500 (HI30; 560777). BCMA-directed CAR T cells were detected using phycoerythrin-labeled recombinant human BCMA/TNFRSF17 protein with a His tag (ACROBiosystems; BCA-HP2H7); clone ID is not applicable.
Stanford flow cytometry validation cohort
Peripheral blood and BM aspirates were processed fresh and in parallel when available. PBMCs were isolated from whole blood by density-gradient centrifugation using Ficoll-Paque Plus. Cells were stained with a fixable amine-reactive viability dye, blocked with Human TruStain FcX and stained with fluorochrome-conjugated antibodies for CAR19 T cell and B cell immunophenotyping. Stained cells were acquired on a four-laser LSRII flow cytometer. Gating of viable CD45+ cells, CD4+ and CD8+ BCMA+ T cells and B cell differentiation subsets were performed in Cytobank by trained research staff blinded to clinical status. Antibodies used in the Stanford flow cytometry assay are included in Supplementary Table 9. The target number of cells was 1,000,000.
CAR T cell AUC analysis
For cellular expansion, absolute CAR T cell counts (cells per microliter) were analyzed on the log10 scale for visualization and modeling. Non-detects or non-positive values were not globally imputed. Values ≤0 were set to a lower limit of detection of 0.1 cells per microliter. The prespecified pharmacodynamic summary was AUC(0–30) days, computed by trapezoidal integration with two constraints: (1) the curve was started at day 0 with value set to 0; and (2) evaluability required at least two non-zero measurements within the first 0–30 days. Linear interpolation was used to estimate day +30 timepoints for AUC integration. Linear interpolation could use measurements up to day +45 for day +30 estimation. AUC-based analyses included only evaluable patients without imputation (complete-case design).
Group comparisons for AUC used two-sided Wilcoxon rank-sum tests (IEC-EC versus no IEC-EC). Associations between AUC and peak inflammatory biomarkers (maximum ferritin, C-reactive protein and lactate dehydrogenase) were quantified with Spearman rank correlations; we report ρ and two-sided P values. To model pretreatment predictors of AUC, we fit ordinary least-squares regression to log10(AUC + 1). Candidate numeric covariates were standardized as z-scores, and categorical factors were included only if they were present with ≥2 levels. Multivariate predictor variables were prespecified. The primary results are presented as ratios of geometric means obtained by exponentiating coefficients and their 95% CIs. This regression used complete-case analysis across variables present in the final model (that is, rows with any missing value among the included predictors or response were omitted without imputation).
Analysis of CAR T cell persistence after day 50
For time-matched persistence after day 50, we implemented a scarcity-first greedy matching of IEC-EC samples to controls under the following rules: (1) IEC-EC and no IEC-EC control pools comprised all samples with day > 50 and ≤ 1 year; (2) the caliper for matching was ±14 days; (3) two controls were paired to each IEC-EC observation (no-IEC-EC:IEC-EC ≤ 2:1) with no control reuse; (4) IEC-EC cases were processed in order of increasing ‘scarcity’, meaning IEC-EC cases with the fewest measurable timepoints were matched first; and (5) rows were excluded if progression occurred before the candidate sample day. Statistical testing involved a Wilcoxon rank-sum test across matched values. Within-set log differences were used to estimate a Hodges–Lehmann median on the log scale with a 95% CI and a median fold change (IEC-EC versus no IEC-EC controls) with interval estimates. Similar results were also obtained using 1:1 matching and a Wilcoxon signed-rank test.
Analysis of ALCs
We analyzed all ALCs as recorded in the electronic medical record (that is, EPIC) without censoring for treatment exposure. ALC was harvested automatically (as opposed to manually). Time was measured in days post-infusion. We first assessed contemporaneous association of ALCs with absolute CAR counts by pairing measurements of the same patient and rounded day and computing Spearman rank correlations in two windows (0–30 days and >30 days).
To compare longitudinal ALC trajectories between patients with and without IEC-EC, we restricted analysis to days 0–100 and modeled log10(ALC) using linear mixed‑effects models (nlme v3.1-168 (ref. 45), splines46). Time was represented with a natural cubic spline (d.f. = 4). Fixed effects included IEC-EC status and its interaction with all spline terms. A patient‑level random intercept accounted for between‑subject heterogeneity. To capture within‑patient serial correlation, we compared models with independent residuals versus a first‑order autoregressive structure and selected an AR(1) correlation model with group‑specific residual variances (varIdent) for IEC-EC versus no IEC-EC. Final estimates were obtained via restricted maximum likelihood. All analyses used available cases without imputation.
Analysis of peripheral blood CAR+ CD4/CD8 ratios
Individuals without any qualifying timepoints were excluded. Analysis included the output of the clinical flow assay, which was a direct CD8/CD4 ratio per timepoint. This ratio was stylistically inverted to obtain a CD4/CD8 ratio instead. Analysis of CD4/CD8 ratios proceeded as described above for all measurements including D0–30 AUC, persistent-timepoint matching and longitudinal CD4 and CD8 values. No day-0 anchor was used for CD4/CD8 ratio analysis as there was no ratio to compute at this timepoint. To mitigate exaggerated CD4/CD8 ratios that occur artifactually at low event counts, all downstream analyses were restricted to timepoints with absolute CAR T cell counts ≥5 cells per microliter.
TCR-sequencing
TCR library generation
Total RNA was isolated using the AllPrep DNA/RNA FFPE kit (cat. no. 80234; lot no. 181027305) and quantified using a Qubit Fluorometer (Invitrogen) and TapeStation 4200 (Agilent Technologies) for quality assessment. TCR CDR3 libraries were prepared using the Cellecta DriverMap AIR TCR CDR3 Profiling Kit (Human RNA), v2, following the manufacturer’s instructions. Amplified libraries were purified using Agencourt AMPure XP beads (Beckman Coulter). Library quality and fragment-size distributions were evaluated using the TapeStation 4200 (Agilent Technologies), and library concentrations were determined using a Qubit Fluorometer (Invitrogen). Indexed libraries were normalized to 4 nM, pooled and sequenced on an Illumina NovaSeq X Plus platform, using paired-end (2× 150 bp) reads with a target depth of approximately 20 M total reads per sample.
TCR library type and alignment
TRB CDR3 amplicons derived from bulk-RNA isolated from FFPE tissue were processed from paired-end FASTQ files using a Cellecta bulk kit (DriverMap AIR TCR CDR3 Profiling Kit, V2 kit). Reads were aligned with MiXCR v4.7.0 (ref. 47) using Cellecta recommended presets (cellecta-new-bulk-kit.yaml) provided by the manufacturer. Cellecta validator barcodes were provided via a fixed –tag-pattern to demultiplex/validate input reads. Only productive clonotypes were exported.
TCR repertoire construction and diversity analysis
Downstream analysis focused on TRB. For each sample’s MiXCR v4.7.0 (ref. 47) clones table, clonotypes were collapsed by identical CDR3 amino-acid sequence (CDR3.aa) to build a unified per-sample repertoire table. Clone proportions were recalculated as Clones/sum(Clones) after collapsing. From per-sample CDR3aa-collapsed repertoires, the following metrics were computed: number of clonotypes, top clone fraction, Shannon entropy, inverse Simpson diversity and clonality (1 − Pielou). Metrics were assembled with sample metadata (patient ID, tissue, day of biopsy, pathology site). The primary hypothesis test compared the top clone fraction between IEC-EC and EC-NOS using a two-sided t-test.
scRNA-seq
Tissue dissociation and single-cell-suspension generation
Cryopreserved human GI and lymph node tissues were thawed at 37 °C. They were enzymatically digested using human tumor dissociation kit (cat. no. 130-095-929) components and the gentleMACS Dissociator (Miltenyi Biotec; program 37C_h_TDK_1). After dissociation, the cell suspension was applied to 70- and 30-µm smart strainers to remove remaining larger particles and debris. The single-cell suspensions were collected by low-speed centrifugation. The cell pellet was resuspended in 1× PBS supplemented with nuclease-free bovine serum albumin, and cell viability was assessed using acridine orange/propidium iodide dye. Samples with ≥85% viability were used for downstream processing.
10x Genomics Chromium single-cell 5’ library construction (GEX and TCR)
Single-cell immune profiling was performed using the 10x Genomics Chromium GEM-X Single Cell Immune Profiling v3 kit (catalog nos. 1000699, 1000252) following the manufacturer’s protocol for measuring immune repertoire information and gene expression from the same cell. Briefly, single cells were partitioned using Gel Beads in emulsion (GEMs) on the Chromium X to target recovery of ~10,000 cells per sample. Barcoding and reverse transcription were performed using the Chromium GEM-X Single Cell 5′ Reagent Kit v3. cDNA amplification, gene expression and TCR (V(D)J) library construction were carried out according to the manufacturer’s instructions. Libraries were purified and assessed for fragment-size distribution and concentration prior to sequencing by using Agilent TapeStation 4200 (cat. no. G2991A) and Qubit 3.0 (Life Technologies, cat. no. Q33216). Genomics Gene Expression (GEX) and TCR (V(D)J) libraries were sequenced using an Illumina NovaSeq X at targeted depths of 50,000 and 5,000 read pairs per cell.
Software
Single-cell RNA processing was performed similar to our prior work13,48,49. The 10x Genomics Cell Ranger (version 7.0.0) mkfastq analysis pipeline was used to demultiplex raw base call files generated by Illumina sequencers into FASTQ files. Analyses were performed in R v4.5.050 using Seurat51 (v5.5.1), Harmony v1.2.452, DESeq253 and GSEA32. Where available, all analyses followed standard Seurat workflows. Data processing and analysis steps are described concisely below.
Single-cell data processing and input objects
Single-cell 10x GEX and TCR (V(D)J) libraries were processed with Cell Ranger multi against GRCh38 references to produce per-sample filtered 10x H5 count matrices and filtered VDJ contig annotation CSVs. For CAR T cell visualization, a custom reference was produced that included both the cilta-cel and axi-cel full-length vector sequences. Axi-cel was used as an internal negative control because the vector is generated from retrovirus (as opposed to lentivirus) and contains minimal cross-homology to lentiviral vectors.
Tissue-aware QC
Per-sample Seurat objects were created from filtered H5 matrices and subjected to tissue-specific QC: for ileum, minimum features ≥100, minimum counts ≥200, maximum features ≤ 20,000, maximum counts ≤ 250,000 and mitochondrial fraction ≤ 60%; for blood, minimum features ≥200, minimum counts ≥500, maximum features ≤ 12,000, maximum counts ≤ 150,000 and mitochondrial fraction ≤ 25%. Cells failing these thresholds were removed. Ileum samples were allowed less stringent QC due to the smaller number of cells processed and expected inflammatory changes within the tissue due to the presence of IEC-EC.
Normalization, integration, embedding and CAR detection
Each sample was normalized with SCTransform54, and then samples were merged with the SCT assay set as default. Dimensionality reduction used principal component analysis followed by batch correction with Harmony v1.2.4 by sample ID. Graph construction, clustering and UMAP were computed from Harmony v1.2.4 embeddings, yielding an integrated object for visualization and downstream analyses. CAR positivity was defined from the RNA assay by extracting per-cell UMI counts for the CAR transgene gene using the assay counts slot. Cells with UMI ≥ 1 were labeled CAR+.
TCR clonotype annotation and diversity testing
TCR clonotypes were attached from 10x VDJ filtered contig annotations. Only productive, high-confidence contigs were kept; TRB contigs were preferred when available, and the best contig per barcode was selected by UMIs and then reads. Barcodes were matched to Seurat cell barcodes. The raw clonotype identifier was used for TCR analyses. Analyses were restricted to CAR+ cells with an assigned clonotype in blood or ileum with valid patient ID.
Within each sample, we computed diversity metrics from the clone-frequency distribution including Shannon entropy, inverse Simpson and clonality (1 − Pielou). The number of clones was then aggregated to patient and tissue using weights equal to the number of CAR+ clonotyped cells per sample. Only paired patient samples (with both blood and ileum) were compared. Paired testing used a two-sided t-test. Paired box plots were generated for all metrics. To ensure depth-matched comparisons, for eligible paired patient samples with at least 25 CAR+ clonotyped cells per tissue, we downsampled without replacement to the minimum cell count across tissues and recomputed the diversity metrics over 1,000 bootstrap iterations per tissue. For final clonal metric analysis in blood samples, the median value of 1,000 bootstraps was used as the comparator to terminal ileum.
Pseudobulk differential expression and GSEA
Differential expression was performed on pseudobulked CAR+ clonotyped (that is, TCR+) cells using only paired patient samples. For each patient sample and tissue, raw RNA counts were summed across cells to form pseudobulk profiles; genes with total counts ≥10 were retained. DESeq2 models with a paired design (~patient ID + tissue) contrasted ileum versus blood. We reported log2 fold changes, Wald statistics and Benjamini–Hochberg-adjusted P values. Genes were ranked by the DESeq2 Wald statistic and tested for gene pathway enrichment using fgsea against the MSigDB Hallmark collection. We reported normalized enrichment scores and Benjamini–Hochberg-adjusted P values.
WGS
WGS library preparation
Genomic DNA was isolated using the AllPrep DNA/RNA FFPE Kit (Qiagen, cat. no. 80234, lot no. 181027305) according to the manufacturer’s instructions. DNA concentration was measured using a Qubit Fluorometer (Invitrogen), and DNA quality and fragment-size distribution were assessed using the TapeStation 4200 (Agilent Technologies). WGS libraries were prepared using the Twist Whole Genome Library Prep Kit following the manufacturer’s protocol. Amplified libraries were purified using Agencourt AMPure XP beads (Beckman Coulter). Library quality and fragment-size distributions were evaluated using the TapeStation 4200 (Agilent Technologies), and library concentrations were determined using a Qubit Fluorometer (Invitrogen). Indexed libraries were normalized to 4 nM, pooled and sequenced on an Illumina NovaSeq X Plus platform using paired-end (2 × 150 bp) reads, with a target depth of approximately 2,134M total reads per sample targeting an average depth of 100×.
WGS data alignment and chimeric read extraction
WGS paired-end reads were trimmed with fastp, aligned with BWA-MEM to a custom hg19 + CAR-vector reference and sorted/indexed with samtools. Vector-associated read pairs were enriched by extracting read names mapping to vector contigs (regex-defined) at MAPQ ≥ 20 and subsetting the binary alignment map (BAM) to those read names; duplicates were marked using GATK55 MarkDuplicates.
Vector–genome junction evidence was called from the duplicate-marked, vector-enriched BAM using two orthogonal signals: discordant pairs (one mate on vector contig, the other on human contig) and split reads parsed from SA:Z tags. Evidence was merged into a standardized junction table and clustered on the genome-side coordinate to define candidate insertion loci, with support quantified as unique read names (total and split/discordant components). Insertion loci were additionally merged using a 500-bp window and summarized per sample with burden and diversity metrics. Insertion clusters were annotated by intersecting against GENCODE19-derived gene/exon/UTR BED tracks using bedtools intersect/closest, assigning feature class (exon > UTR > intron > genomic) and nearest gene/distance. Filtered clusters were visualized with the circlize v0.4.17 package in R. A total of two unique chimeric reads were required to call a given insertion7 in any sample.
Vector integration by anchored multiplex PCR sequencing
Genomic DNA (25–250 ng), quantified by Qubit fluorometry, was used to prepare next-generation sequencing libraries with the Archer VARIANTPlex Library Preparation Kit (Integrated DNA Technologies) according to the manufacturer’s instructions. The VARIANTPlex workflow uses anchored multiplex PCR (open-ended amplification). A molecularly barcoded sequencing adapter was ligated to the sheared end of each DNA fragment, and targets were enriched through two rounds of target-specific nested PCR. The first round used an outer gene-specific primer (GSP1), followed by a nested gene-specific primer (GSP2) positioned closer to the target-unknown sequence boundary. Both primers extended from the known target sequence toward the ligated adapter. The molecular barcode served as a UMI, permitting molecule-level deduplication during analysis.
To identify cilta-cel lentiviral vector integration sites, GSP1 and GSP2 primers were directed against sequences within the proviral LTRs, with GSP2 nested relative to GSP1 toward the LTR-host junction. This design generated amplicons extending across the vector–genome boundary, such that the aligned host-genome portion of each junction-spanning read defined the integration site. The supplied cilta-cel reference FASTA contained a single 5,640-bp contig spanning vector positions 1–5,640. Two oppositely oriented GSP2 primers targeted the R and U5 regions of the LTR. The R-directed GSP2 sequence was 5’-GGCTTAAGCAGTGGGTTCCCTAGTT-3’, and the U5-directed GSP2 sequence was 5’-GTGTGTGCCCGTCTGTTGTGTGACT-3’. In the supplied vector reference, the R-directed primer binding sequence occurred at positions 47–71 and 5,506–5,530 in reverse-complement orientation, whereas the U5-directed primer binding sequence occurred at positions 103–127 and 5,562–5,586 in forward orientation, consistent with one target copy in each LTR. The R-directed assay recovered the 5’ vector–host junction, and the U5-directed assay recovered the 3’ vector–host junction. GSP1 sequences were proprietary to the assay provider. Two genomic loci, DUOX2 on chromosome 15 and SLC25A20 on chromosome 3, were included as genomic process controls. The control GSP2 target coordinates were defined relative to hg19.
Final libraries were quantified by qPCR using the KAPA Library Quantification Kit for Illumina platforms (Roche/KAPA, KK4844, cat. no. 07960255001) against a six-point DNA standard curve ranging from 20 to 0.0002 pM. The resulting library concentration was approximately 100 nM, with a range of approximately 20–150 nM across samples. This corresponded to approximately 6.04 × 10 × 10 library molecules per microliter, with a range of 1.23–9.06 × 10 × 10 molecules per microliter. Libraries were sequenced on an Illumina platform using a 150-8-8-150-cycle read configuration, corresponding to paired-end 150-bp reads and dual 8-bp index reads.
Raw FASTQ reads were processed using the Archer Analysis pipeline. Reads were initially screened for the expected assay common-region sequence, after which sequencing adapters were trimmed. Read length was evaluated following adapter removal, and reads shorter than 35 bp were discarded. The retained reads were aligned to the hg19 human reference genome to generate sequence alignment map (SAM) alignment files, which were filtered to retain high-quality alignments. Reads containing the expected lentiviral LTR sequence together with an alignable host-genome segment were identified as candidate vector–host junction reads. The genomic coordinate of the aligned host segment was used to define the integration site, and integration-site summary files were generated for downstream analysis.
For downstream clonal analysis and figure generation, reads were collapsed by UMI to estimate the number of independently captured vector–host junction molecules. UMI-deduplicated junctions whose host-genome coordinates occurred within a 100-bp window were clustered as a single integration locus. Each unique integration locus was considered a clone. Integration sites were annotated using RefGene transcript models to determine the affected gene, genomic feature and intron or exon position.
For each sample, clone abundance was calculated as the number of UMI-collapsed molecules assigned to an integration locus divided by the total number of integration-supporting molecules detected in that sample. The locus with the greatest molecular abundance was designated the dominant clone. Integration loci were ranked by molecular support. Clone 1 represented the dominant integration site, clones 2–5 represented the next four most abundant integration sites, minor clones were sites outside the five most abundant clones supported by at least two molecules, and singletons were integration sites supported by one molecule.
For dominant integration sites with junctions recovered from both proviral ends, the 5’ and 3’ host breakpoints were determined independently from the respective junction-read distributions. The offset between the paired host breakpoints was used to determine the TSD. Overlapping host sequence at the two junctions was interpreted as a TSD, whereas an intervening genomic gap indicated deletion of host sequence at the integration site. Data visualization was performed in Python using NumPy and Matplotlib.
WES
WES library generation
Genomic DNA was isolated using the AllPrep DNA/RNA FFPE Kit (Qiagen, cat. no. 80234, lot no. 181027305) according to the manufacturer’s instructions. DNA quantity was measured using a Qubit Fluorometer (Invitrogen), and DNA quality and fragment-size distribution were assessed using the TapeStation 4200 (Agilent Technologies). WES libraries were prepared using the Agilent SureSelect Human All Exon v7 kit following the manufacturer’s protocol. Amplified libraries were purified using Agencourt AMPure XP beads (Beckman Coulter). Library quality and fragment-size distributions were evaluated using the TapeStation 4200 (Agilent Technologies), and library concentrations were determined using a Qubit Fluorometer (Invitrogen). Indexed libraries were normalized to 4 nM, pooled and sequenced on an Illumina NovaSeq X Plus platform using paired-end (2 × 150 bp) reads, with a target depth of approximately 300M total reads per sample.
WES alignment and preprocessing
Paired-end FASTQ files were aligned to hg19/b37 using BWA-MEM2 v2.2.1 (ref. 56). SAM output was streamed to samtools for coordinate sorting and indexing to produce the primary BAM. PCR/optical duplicates were marked with GATK v4.5.0.0 MarkDuplicates (Picard) with metrics recorded and a coordinate-sorted, indexed deduplicated BAM generated. Base quality recalibration was applied using dbSNP138, Mills and 1000G gold-standard indels and 1000G known indels.
Somatic variant calling and annotation
Variants were called with GATK Mutect2 in tumor-only mode on padded calling intervals derived from the panel BED. The gnomAD database was provided as the germline population prior as well as the default GATK exome panel of normals. Variants were filtered with FilterMutectCalls using both contamination tables and the learned orientation priors. We retained only ‘pass’ sites and excluded multinucleotide polymorphisms.
Filtered VCFs were functionally annotated with GATK Funcotator (hg19, data sources v1.8) to Mutation Annotation Format. Variants were then sequentially screened as follows: (1) dropped entries without a valid gene symbol; (2) removed blacklisted loci (HLA, KIR, IG/TCR, olfactory receptors, MUC family, TTN, PDE4DIP, ANKRD*); (3) retained only non‑synonymous classes (Missense, Nonsense, Frame‑Shift In/Del, In‑Frame In/Del, Splice_Site/Region, Translation_Start_Site, Nonstop); (4) applied a population‑frequency filter, keeping variants with pop_af ≤ 0.01 (NA allowed) and, by default, not filtering listed driver genes unless explicitly enabled; and (5) filtered candidate genes with variant allele frequency ≥ 2% of reads, >5 unique reads of alternate allele support and ≥100× total coverage at the variant site.
Bulk RNA-seq analysis
Bulk RNA library preparation
Total RNA was isolated using the AllPrep DNA/RNA FFPE kit (cat. no. 80234; lot no. 181027305) and quantified using a Qubit Fluorometer (Invitrogen) and TapeStation 4200 (Agilent Technologies) for quality assessment. RNA libraries were prepared using the Takara SMART-Seq Total RNA Pico Input with UMIs (ZapR Mammalian) (cat. no. 634355) following the manufacturer’s instructions. Briefly, total RNA was converted to cDNA, and then adapters for Illumina sequencing (with specific barcodes) were added to the PCR. The PCR products were purified and then ribosomal cDNA depleted. The cDNA fragments were further amplified with primers universal to all Illumina libraries. The PCR products were purified once more to yield the final cDNA library.
The library quality and quantity were confirmed using TapeStation 4200 and Qubit. Indexed libraries were pooled, normalized to 4 nM and sequenced on the Illumina NovaSeq X Plus platform using paired-end (2 × 150 bp) reads, with a target depth of approximately 40M total reads per sample. Raw FASTQ files were assessed for sequencing quality using FastQC57 (v0.11.9), evaluating base quality, GC content, duplication levels, over-represented sequences and adapter contamination. Adapter trimming and removal of low-quality bases were performed using fastq-mcf58 (v1.05) and cutadapt59 (v4.7), followed by removal of contaminant reads (ribosomal RNA, mitochondrial, transfer RNA and other unwanted sequences) using Bowtie260 (v2.5.3). Cleaned paired-end reads were aligned to the GRCh38/hg38 human reference genome (Ensembl release 87) using STAR61 (v2.7.11b) in two-pass mode to improve detection of known and new splice junctions. Alignment quality, read distribution across genomic features, strand specificity, splice-junction annotation and gene body coverage were evaluated using RNA-SeQC62 (v2.4.2) and RSeQC63 (v3.0.1) and summarized with MultiQC64 (v1.21).
RNA data alignment
Gene-level expression quantification was performed using HTSeq65 (v2.0.5) to obtain raw counts, and transcript abundance estimates (FPKM) were generated using StringTie66 (v3.0.0). For CAR-T-specific analysis, custom CAR construct sequences were appended as additional contigs to the reference genome FASTA and corresponding gene annotations were added to the GTF file followed by the analysis described above.
RNA expression analysis
Gene‑level expression was collapsed by gene symbol using the median across rows and then transformed as log2(FPKM + 1). Differential expression between IEC-EC cases versus EC-NOS cases was performed on the log2(FPKM + 1) matrix using limma v3.64.367 with a simple design (~cohort, control as reference) and robust eBayes. Results were exported via topTable (BH‑adjusted P). Hallmark GSEA was run with fgsea v1.34.2 on preranked statistics and visualized as bar plots of significant pathways (false discovery rate < 0.05). Vector insertion sites were identified in WGS data as noted above and compared as (1) per‑gene with‑insertion versus without‑insertion, (2) paired per‑gene tests versus each sample’s median ‘other‑genes’ and (3) per‑sample z-scores versus non‑inserted peers. For other gene analysis, only the top 50th percentile of expressed genes was considered to reduce bias associated with non-expressed genes in GI tissue.
RNA splicing analysis
Coordinate-sorted RNA-seq BAM files aligned to the GRCh38 reference genome were analyzed in R using Rsamtools v2.24.1, GenomicAlignments v1.44.0, GenomicRanges v1.60.0 and rtracklayer v1.68.0. Gene, transcript, exon and coding-sequence annotations were obtained from the Ensembl GRCh38 release 87 GTF. Secondary, supplementary and unmapped alignments were excluded. Alignments overlapping GTF-defined target-gene regions, including 1-kb flanking regions, were retrieved, and split-read junctions were extracted from gapped alignment CIGAR strings. Junction coordinates were compared with the annotated transcript–intron catalog to distinguish exact annotated junctions from new or non-exact junctions.
For each sample–gene combination, absent junctions were assigned a count of zero, and within-gene junction usage was calculated as the reads supporting each junction divided by the total junction-supporting reads assigned to that gene region. Sample–gene combinations with fewer than five total junction-supporting reads were excluded from gene-level summaries. Junction-use entropy was calculated as H = −sum(P(i) × log(P(i) + 10−6)), where P(i) is the within-gene usage fraction of junction i. The vector-inserted sample for each target gene was compared with all other evaluable samples for that gene.
For each insertion-targeted gene, splice-junction usage in the vector-inserted sample was compared with that in all other evaluable samples. For most genes, the inserted sample remained within the reference distribution of splice-junction entropy, arguing against widespread reorganization of splicing (Supplementary Fig. 9a). We nevertheless recognize that a global entropy measure may not detect changes affecting individual junctions.
Patient 32 represented the principal exception warranting closer evaluation. The vector insertion in this patient occurred within exon 3 of MAFG, in its 3’ untranslated region, and was also located within approximately 3 kb of the SIRT7 transcription start site. Although global SIRT7 splice-junction entropy remained within the reference distribution, junction-level analysis demonstrated altered relative usage of several SIRT7-region splice junctions in the affected sample (Supplementary Fig. 9b). Analysis of the canonical protein-coding SIRT7 transcript, ENST00000328666 (primary transcript), similarly showed redistribution of relative coverage across several exons but no complete loss of coverage across the coding transcript (Supplementary Fig. 9c). In contrast, the exon-coverage distribution of the canonical MAFG transcript, ENST00000357736 (primary transcript), remained within the range observed in the other samples (Supplementary Fig. 9d).
Taken together, these analyses did not identify evidence of widespread splice disruption, premature transcriptional termination or complete loss of coding-exon coverage among the insertion-targeted genes. The findings in Patient 32 are compatible with localized SIRT7 splice-path remodeling, but the functional consequence remains uncertain, and we consider this finding hypothesis-generating. In sum, overall, we felt there was no evidence for systematic splice disruption associated with lentiviral vector integrations.
Gene function of vector insertion targets
CDK11B encodes a cyclin-dependent serine/threonine kinase involved in transcription, pre-messenger-RNA splicing, cell-cycle progression, cytokinesis and apoptosis. CDK11 activity has been described as a survival dependency and possible therapeutic target in multiple tumor models, but CDK11B is not generally classified as a canonical tumor-suppressor gene. One interpretive limitation is that CDK11B lies in a duplicated locus and encodes a protein nearly identical to CDK11A; short RNA-seq reads and very long apparent junctions can therefore be affected by paralogous mapping68. However, we do not see evidence of systemic gene expression or splice disruption of this transcript.
WWP2 encodes a NEDD4-family HECT E3 ubiquitin ligase with multiple isoforms that regulate protein turnover and signaling. Its clearest cancer-relevant mechanism is ubiquitination and degradation of PTEN, linking increased WWP2 activity to pro-oncogenic PI3K–AKT signaling; WWP2 also intersects with TGFβ/SMAD biology. These effects are substrate-, isoform- and tissue-dependent69.
GANAB encodes the catalytic alpha subunit of endoplasmic-reticulum glucosidase II and participates in N-glycan processing, glycoprotein folding and QC. It is not an established recurrent cancer driver. Higher GANAB expression has been associated with higher grade and unfavorable outcome in urothelial carcinoma70.
MAFG encodes a small Maf bZIP transcription factor that lacks a conventional activation domain and functions through partner-dependent heterodimers; it can therefore support either transcriptional activation or repression. A direct cancer mechanism has been demonstrated in BRAF(V600E)-positive colorectal cancer, where MAFG contributes to MLH1 silencing and the CpG-island methylator phenotype. This supports describing MAFG as a context-dependent pro-oncogenic transcriptional regulator. Because the Patient 32 insertion is in the MAFG 3′ UTR, a biologically relevant effect could involve RNA stability, polyadenylation or translation without necessarily disrupting coding exons71. However, no such gene-level disruption is noted in global expression abundance or splice pattern.
SIRT7 encodes an NAD+-dependent deacetylase with nucleolar and chromatin functions in ribosome biogenesis, transcriptional regulation, stress responses and DNA repair. Its cancer biology is genuinely dual: SIRT7-mediated H3K18 deacetylation can maintain oncogenic transformation, and SIRT7 also promotes genome integrity and non-homologous end joining. Accordingly, SIRT7 can have protumorigenic or protective effects depending on cellular context. At the MAFG/SIRT7 locus, proximity of the insertion to the SIRT7 transcription start region and the comparatively coherent junction redistribution make SIRT7 the strongest local candidate for an RNA-processing effect; however, the current data do not establish loss of a full-length coding transcript or altered SIRT7 protein output72.
AC002116.7 encodes an Ensembl-annotated antisense long noncoding RNA at the CLIP3-region locus. Its molecular function is not well established73.
CLIP3 encodes a CAP-Gly cytoskeletal linker/scaffold associated with microtubules, organelle membranes and membrane-localized signaling. Experimental work on CLIPR-59 showed interaction with Akt and regulation of Akt cellular compartmentalization, providing a biologically plausible connection to growth signaling. Nevertheless, CLIP3 is not an established recurrent cancer driver or tumor-suppressor gene74.
PPP6R2 encodes a regulatory subunit of protein phosphatase 6. The PP6 holoenzyme dephosphorylates Aurora A–TPX2 and helps control mitotic spindle formation and chromosome alignment, making substantial loss biologically capable of affecting mitotic fidelity. PPP6R2 itself, however, is not an established canonical tumor suppressor, and evidence concerning the PP6 catalytic subunit PPP6C should not be automatically transferred to the regulatory subunit75.
ATP6V1G3 encodes the G3 subunit of the cytosolic V1 sector of vacuolar H+-ATPase, which supports ATP-driven proton transport and acidification of intracellular compartments. ATP6V1G3 has utility as a lineage marker in chromophobe renal cell carcinoma, but it is not an established oncogene or tumor suppressor76. ATP6V1G3 is minimally expressed in this dataset and may not be actively transcribed in IEC-EC. It is the only gene with a dominant vector insertion event that has minimal gene expression in the cohort.
LEF1 encodes a DNA-binding transcription factor in Wnt/β-catenin signaling and lymphoid development. Its locus uses alternative promoters and splicing to generate proteins with opposing biological activities: full-length, β-catenin-responsive LEF1 can support oncogenic transcriptional programs, whereas an N-terminally truncated alternative-promoter product acts dominantly negative. LEF1 is therefore best described as an isoform- and context-dependent cancer regulator. Gene-level RNA abundance can obscure a meaningful LEF1 isoform shift, so promoter- and junction-specific evidence is particularly relevant77. LEF1 is known to be overexpressed in some T cell lymphomas77,78.
Reporting summary
Further information on research design is available in the Nature Portfolio Reporting Summary linked to this article.